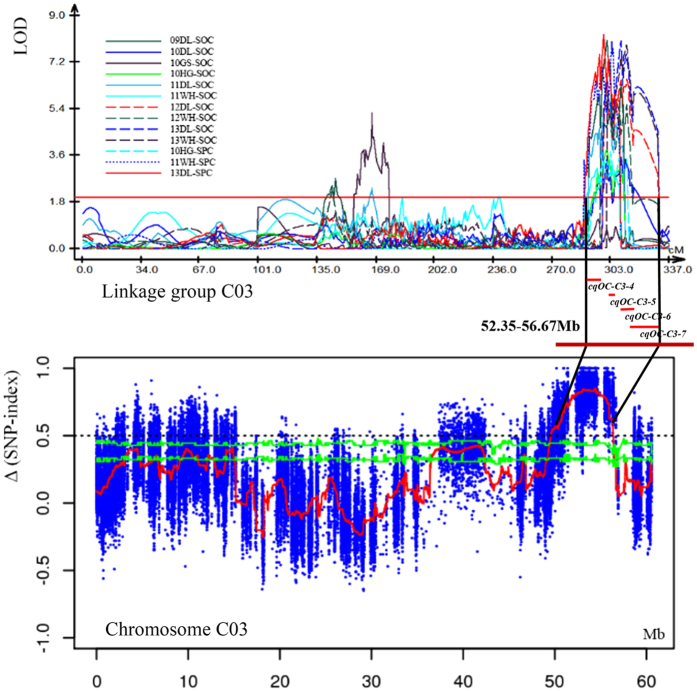
Figure 3. Overlapping region of AGR and SOC-QTL hotspots on chromosome C03.
Original QTL identification in the different experiments shown by curves above the line of the linkage group (top). The Δ(SNP-index) plot with statistically significantly associated regions (two green significant threshold lines, P < 0.01 and P < 0.05) is drawn at the bottom. The X-axis represents the position of chromosome C03, and the Y-axis represents Δ(SNP-index). An overlapping region of 52.35–56.67 Mb is drawn in the middle, and the small red bars under the linkage group line within QTL hotspots represent consensus QTLs that overlap with AGR.

