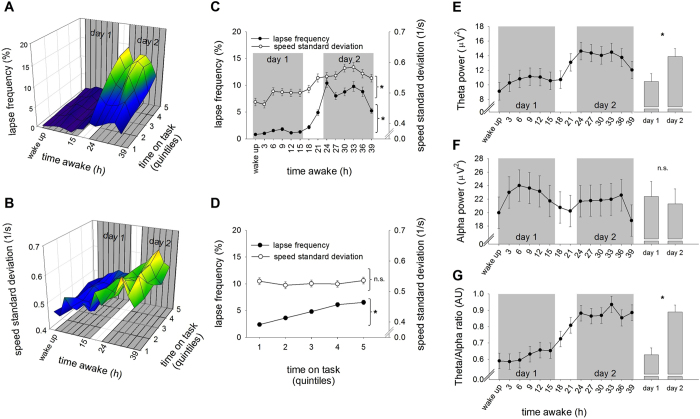
Figure 1. Psychomotor vigilance task (PVT) performance and waking EEG oscillations across prolonged wakefulness.
Evolution of psychomotor vigilance task (PVT) performance and waking EEG oscillations across prolonged wakefulness. (A,B) Vertical axes (y-axes) on the 3D plots represent attention lapses (lapse frequency) and response variability (standard deviation of response speed), as a function of time awake (x-axis) and time-on-task (z-axis). Warmer colors represent higher lapse frequency and increased response variability. (C,D) 2D plots illustrating increased lapse frequency and response variability by sleep deprivation and increased lapse frequency by time-on-task. (E–G) Effects of sleep deprivation on waking EEG theta activity, alpha activity, and theta/alpha ratio (TAR). The gray background shows the data included in the statistical analyses, categorized as day 1 (baseline) and day 2 (sleep deprivation). Stars indicate least significant difference (LSD) between day 1 and day 2 (p < 0.0001).

