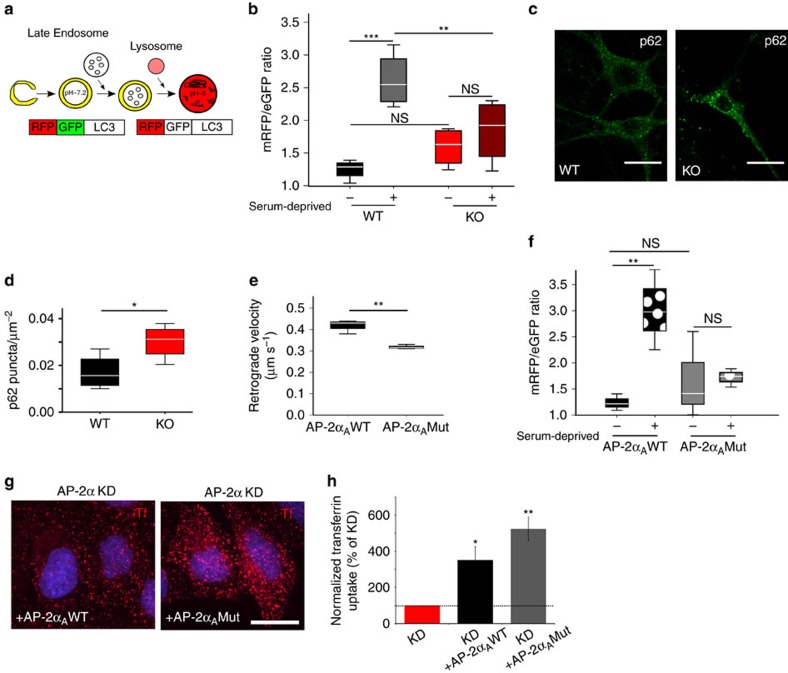
Figure 4. AP-2 regulates autophagosome turnover independent of its role in endocytosis.
(a) Tandem mRFP-eGFP-tagged LC3 as a reporter of autolysosome formation. (b) Mean mRFP/eGFP intensity ratio in control or serum-deprived WT or AP-2μ KO neurons (n=6 independent experiments, with 37–54 neurons per condition). No significant difference between WT and AP-2μ KO neurons was observed at steady state (P=0.398). Serum deprivation failed to trigger the formation of autolysosomes in AP-2μ neurons (control WT: 1.247±0.092, serum-deprived WT: 2.847±0.213, ***P<0.001, control KO: 1.528±0.130, serum-deprived KO: 1.774±0.169, P=0.640; serum-deprived WT versus serum-deprived KO **P=0.002). (c) Representative confocal images of WT and AP-2μ KO neurons immunostained for p62. Scale bars, 20 μm. (d) Increased number of p62-positive puncta per μm2 in AP-2μ KO (0.030±0.003) compared to WT neurons (0.017±0.003). *P=0.046, n=4, 33–39 neurons per condition. See also Supplementary Fig. 4g. (e) Average retrograde velocity of mRFP-LC3 carriers in control neurons expressing AP-2αA WT or LC3 binding-deficient AP-2αA Mut and co-expressing mRFP-eGFP-LC3. Loss of LC3-AP-2α binding significantly decreased LC3 transport compared to AP-2αA WT expressing controls (AP-2αAWT: 0.42±0.00 μm s−1, AP-2αAMut: 0.32±0.01 μm s−1, **P=0.007, n=3 independent experiments, ≥45–47 neurites per condition). (f) Mean mRFP/eGFP intensity ratio in control or serum-deprived neurons expressing AP-2αAWT or AP-2αAMut (n=4 independent experiments, ≥25 neurons per condition). No significant difference between neurons expressing AP-2αAWT or AP-2αAMut was observed at steady state (P=0.661). Serum deprivation fails to trigger autolysosome formation in neurons expressing AP-2αAMut (control AP-2αAMut: 1.544±0.361, serum-deprived AP-2αAMut: 1.775±0.088, P=0.886), but not in neurons expressing AP-2αAWT (control AP-2αAWT: 1.173±0.091, serum-deprived AP-2αAWT: 2.660±0.240, **P=0.003). (g,h) LC3-binding defective AP-2αA (AP-2αA Mut) restores clathrin-mediated endocytosis of transferrin in HeLa cells depleted of endogenous AP-2α (KD) (*P=0.041, **P=0.007, n=4, 156, 124, 148 cells per condition, respectively). Mean grey values of transferrin uptake in KD+AP-2αAWT and KD+AP-2αAMut conditions were normalized to KD condition set to 100%. Scale bar, 20 μm. Tf, transferrin. Data in b,d,e,f are illustrated as box plots as described in Methods. Data in h and all data reported in the text are mean±s.e.m. NS, non-significant.

