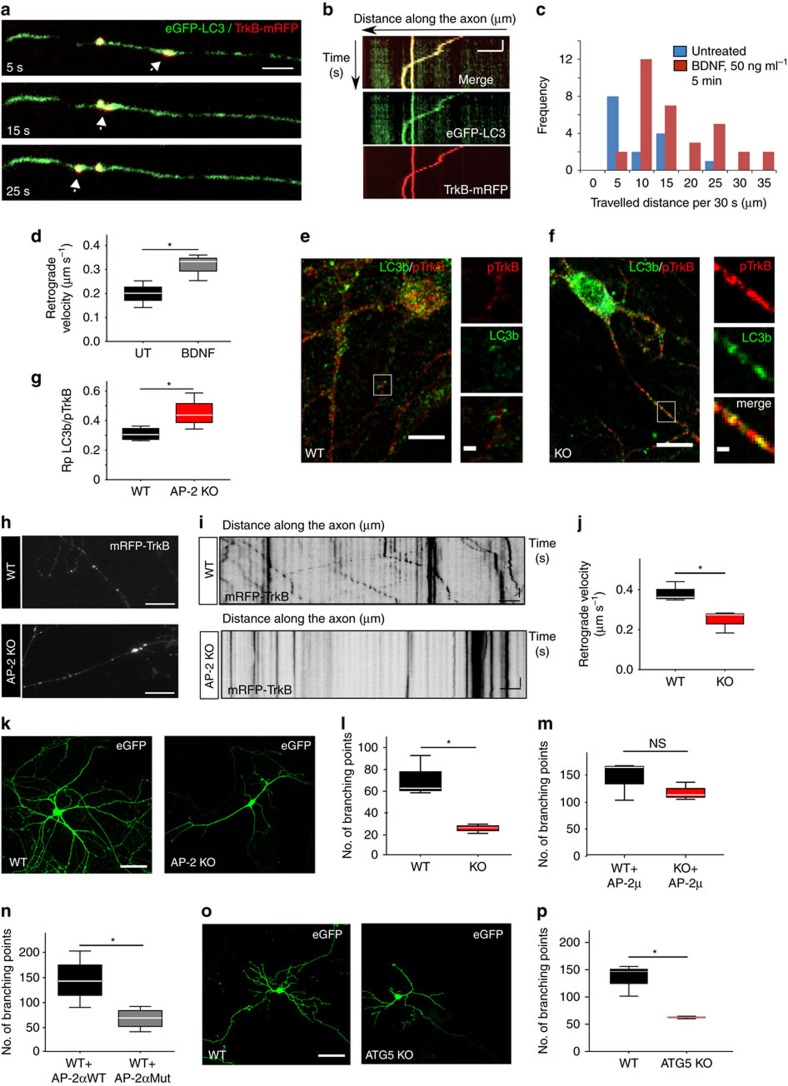
Figure 5. Autophagosome transport by AP-2 promotes neuronal complexity.
(a,b) Representative time series (a) and corresponding kymographs (b) of eGFP-LC3/TrkB-mRFP-positive carriers in the axon. Scale bars, (a) 3 μm, (b) 5 μm × 5 s. (c) Total distance of eGFP-LC3/TrkB-mRFP puncta travelled during a 30 s run when either left untreated or in the presence of BDNF. (d) BDNF significantly increases the retrograde velocity of eGFP-LC3/TrkB-mRFP-positive carriers compared to controls (Control: 0.198±0.0032 μm s−1, BDNF: 0.315±0.032 μm s−1; *P=0.036, n=3 experiments, 16–33 neurites per condition). (e,f) WT or AP-2μ KO neurons immunostained for LC3b and phospho-TrkB (pTrkB). White boxes indicate panels magnified to the right. Scale bars, (e) 10 μm, (f) 2 μm. (g) Colocalization of pTrkB with LC3b based on Pearson's coefficient (Rp) (WT: 0.3±0.02, AP-2 KO: 0.45±0.01, *P=0.043, n=4 experiments, 60–64 ROIs per condition). (h,i) Representative epifluorescent images and corresponding kymographs of TrkB-mRFP-positive puncta in WT and AP-2μ KO neurons. Scale bars, 5 μm. (j) TrkB velocity is decreased in AP-2 KO neurons compared to WT (WT: 0.39±0.03 μm s−1, KO: 0.25±0.03 μm s−1, *P=0.033, n=3 experiments, 44–48 neurites per genotype). (k) eGFP-expressing WT or AP-2μ KO neurons at DIV14. Scale bar, 40 μm. (l) Mean number of branching points in WT (69.78±10.76) and AP-2μ KO neurons (24.25±2.46, *P=0.014, n=3 experiments, 22–25 neurons per genotype). See also Supplementary Fig. 6b. (m) Mean number of branching points in WT and AP-2μ KO neurons co-expressing eGFP and AP-2μ (WT+AP-2μ: 144.99±25.31, KO+AP-2μ: 118.38±9.45, P=0.308, n=3 experiments, 29–31 neurons per condition). See also Supplementary Fig. 6a,c. (n) Mean number of branching points in control neurons expressing WT HA-AP-2αA (HA-AP-2αAWT) (144.131±13.43) or LC3-binding deficient mutant AP-2αA (HA-AP-2αAMut) (66.36±17.55) (*P=0.024, n=4 experiments, 32–38 neurons per condition). See also Supplementary Fig. 6d,e. (o) eGFP-expressing WT or ATG5 KO neurons. Scale bar, 40 μm. (p) Mean number of branching points in WT or ATG5 KO neurons (WT: 134.69±16.84; KO: 62.62±18.11) (*P=0.013, n=3 experiments, 35–42 neurons per genotype). See also Supplementary Fig. 6m. Data in d,g,j,l,m,n,p are illustrated as box plots as described in Methods. Data in c and all data reported in the text are mean±s.e.m.

