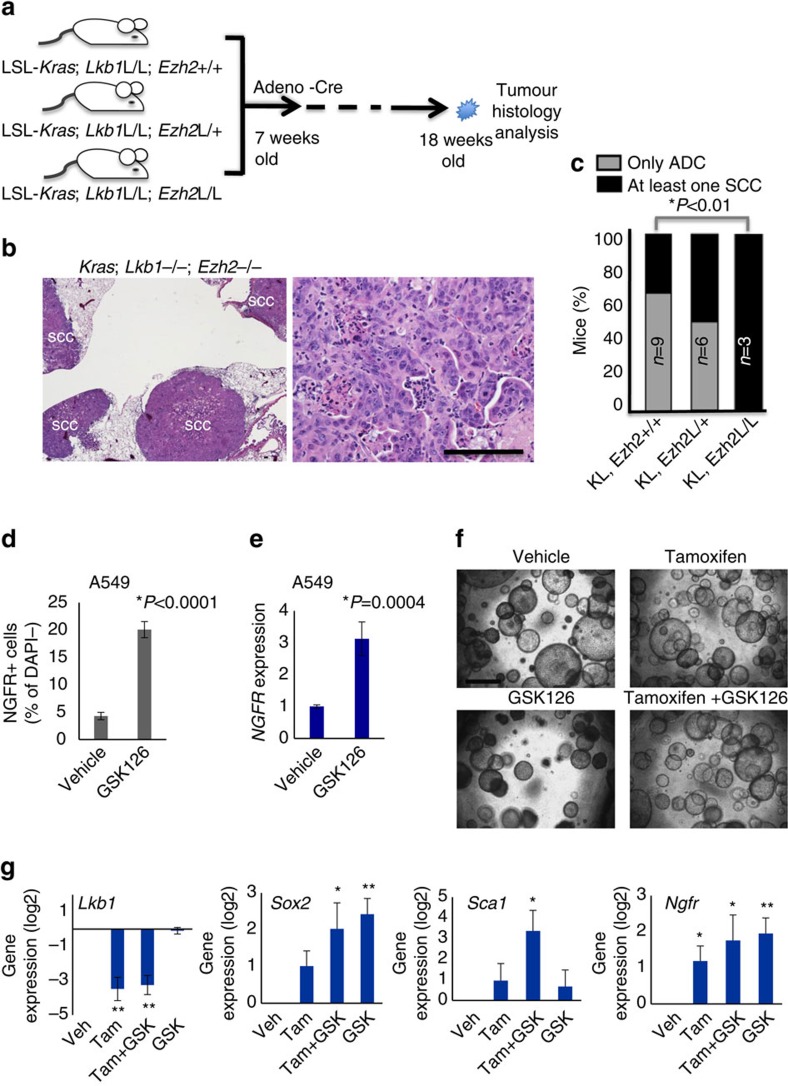
Figure 4. Deletion or inhibition of EZH2 potentiates SCC transition.
(a) Schematic of deletion of Ezh2 in addition to KRAS activation and Lkb1 deletion. (b) Haematoxylin and eosin staining of tumours at 11 weeks post Adeno-Cre show predominant SCC histology in the Ezh2fl/fl; KrasG12D; Lkb1fl/fl mice, scale bar, 50 μm. (c) Percentage of mice with at least one purely squamous lesion as determined by histology at end point in the four cohorts, n and P values indicated in the figure, P values represent χ2-test. (d) Flow for NGFR in the KRAS+/LKB1-null human line A549 treated 10 μM of EZH2 inhibitor GSK126 for 6 days, data are mean±s.e.m., n=4, P<0.0001. (e) RT-qPCR for NGFR expression in the A549-treated lines, data are mean±s.e.m., n=4, P=0.0004. (f) Representative images of indicated secondary tumour organoids plated at 20,000 cells per transwell, scale bar, 200 μm. (g) RT-qPCR for Sox2, Sca1 and Lkb1 in tumour organoid 3D cultures treated with 100 nM tamoxifen, 5 μM of EZH2 inhibitor GSK126, or both for 9–12 days, mean±s.e.m. on log2 scale is graphed, **indicates P<0.01, *indicates P<0.05, n=4. P values for d, e and g represent two-tailed t-test. See also Supplementary Fig. 4a–e.

