Fig. 3.

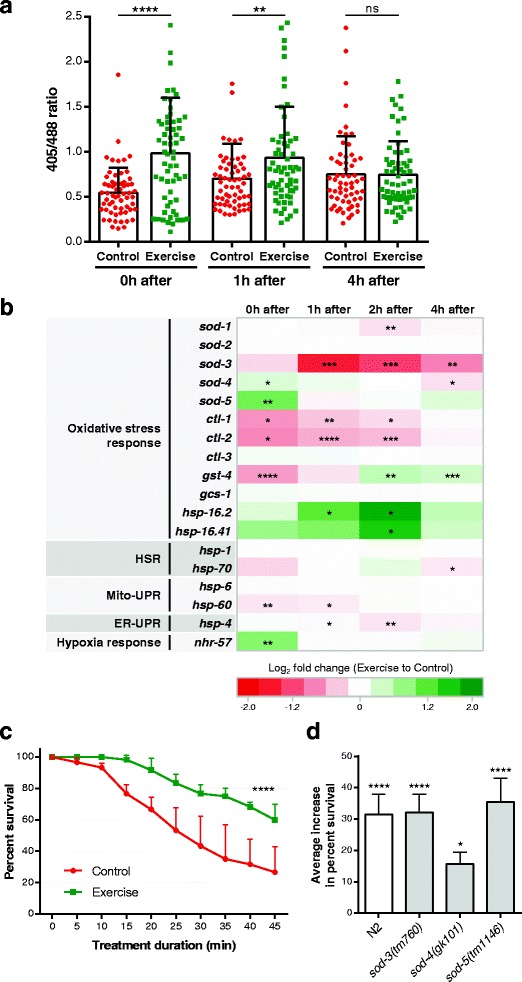
C. elegans swim exercise increases muscle mitochondrial oxidation and induces a specific transcriptional oxidative stress response. a Relative mitochondrial oxidation level of P myo-3 mito-roGFP-expressing animals at different time points post-exercise (higher 405/488 ratios indicate increased oxidation levels). We took confocal images of body wall muscle at both 405 nm and 488 nm excitation and used the mean fluorescence intensities of mitochondrial regions (40–50 regions per animal) to calculate the 405/488 ratios. Each point represents the 405/488 ratio average from a single animal (n = 60–63 animals); statistical significance was determined by unpaired two-tailed Student’s t test. b Heat map summarizing quantitative polymerase chain reaction results in N2 animals for commonly used stress reporter genes at different time points post-exercise (n = 5 independent trials). Expression data are presented as the log2 fold change of exercise samples relative to control samples in a color gradient from red (downregulation) to dark green (upregulation). White represents no change in expression levels. Paired two-tailed Student’s t tests were used to compare relative expressions of control versus exercise samples at each time point. See Additional file 1 and Additional file 4A–F for detailed results for each gene. c Percentage of surviving N2 animals during treatment with 3 mM juglone 4 hours post-exercise (n = 60 animals). d Average increase in percent survival during treatment with 3 mM juglone 4 hours post-exercise of N2, sod-3(tm760), sod-4(gk101), and sod-5(tm1146) exercised animals relative to control counterparts (n = 60 animals). The average increase in percent survival was calculated from all the time points between 15 and 45 min of treatment duration. Note that the reduced survival benefit of exercised sod-4 mutants was not due to a reduced swimming capacity relative to N2 and the other sod mutants. See Additional file 3B–D for detailed survival curves of sod mutants. Statistical significance in (c) and (d) determined by a log-rank test comparing control versus exercise survival curves. *P < 0.05; **P < 0.01; ***P < 0.001; ****P < 0.0001. ER-UPR endoplasmic reticulum unfolded protein response, HSR heat shock response, ns, non-significant, mito-UPR mitochondrial unfolded protein response
