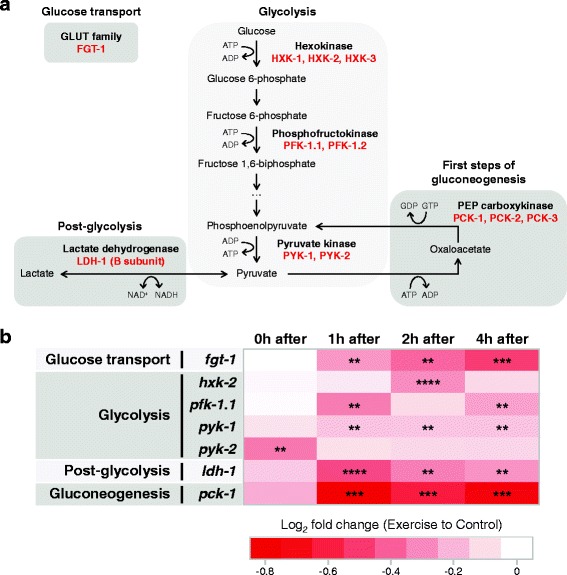
Fig. 4.

Transcriptional changes in C. elegans are consistent with reduced glucose metabolism after swim exercise. a Diagram of glucose metabolism highlighting the steps that we chose for our expression analysis. C. elegans proteins are shown in red. For simplicity, several metabolic steps are omitted. b Heat map summarizing quantitative polymerase chain reaction results in N2 animals at different time points post-exercise for glucose metabolic genes (n = 5 independent trials). Expression data is presented as log2 fold change of exercise samples relative to control samples in a color gradient from red (downregulation) to white (no change). Paired two-tailed Student’s t tests were used to compare relative expressions of control versus exercise samples at each time point. See Additional file 5 for detailed results for each gene. **P < 0.01; ***P < 0.001; ****P < 0.0001
