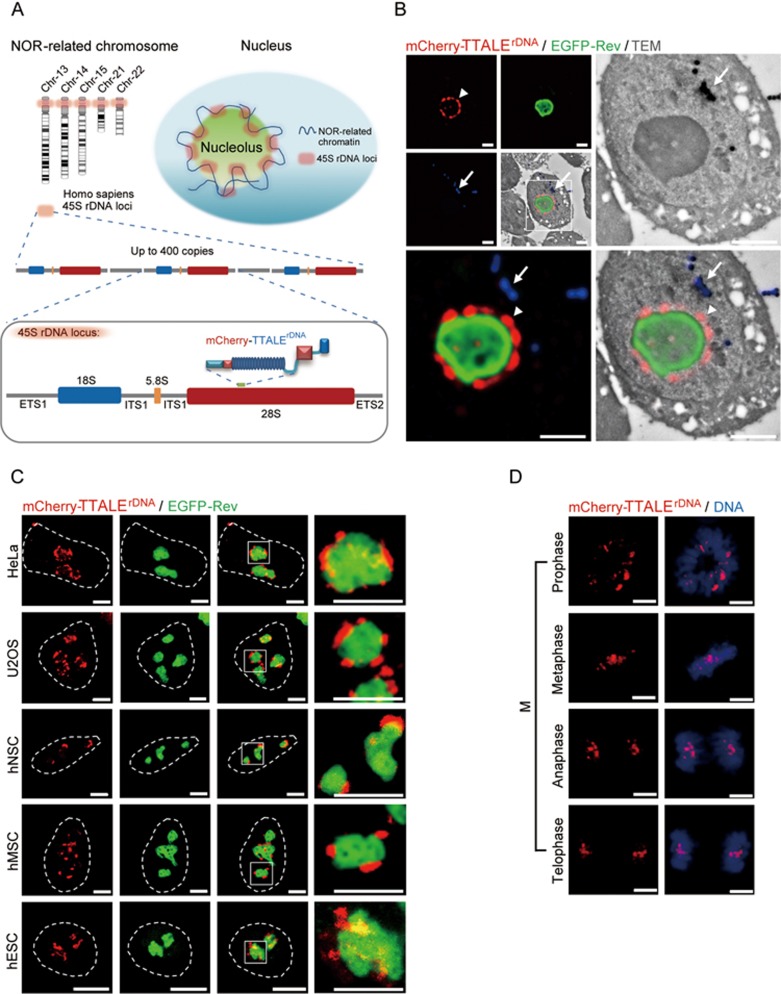
Figure 5.
TTALE-based imaging of NOR-rDNAs. (A) Schematic diagram showing distribution and structural features of NOR-rDNAs in the human genome. (B) Co-localization analysis of mCherry-TTALErDNA (red) and EGFP-Rev (green, labeling nucleolus) signals captured by SIM-TEM. Arrowhead indicates mCherry-TTALErDNA signals at perinucleolar regions. Arrow indicates the fiducial marker (blue) for precise alignment of SIM and TEM images. Scale bars, 2 μm. (C) Live cell co-localization analysis of mCherry-TTALErDNA (red) and EGFP-Rev (green) in the indicated cell types. Dashed lines indicate the nuclear boundary. Scale bars, 5 μm. (D) Visualization of rDNA at different stages of mitosis in HeLa cells using mCherry-TTALErDNA (red). Hoechst was used to stain DNA (blue). Scale bars, 5 μm.

