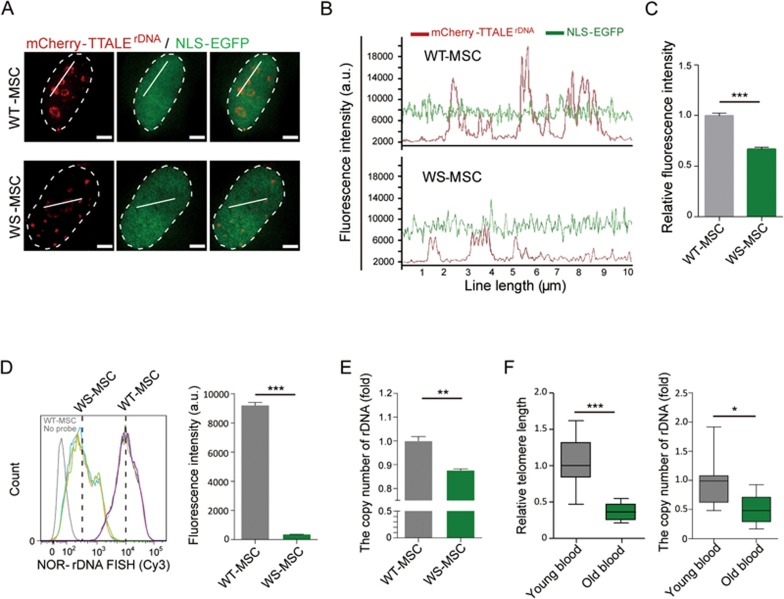
Figure 7.
TTALE-based imaging indicating physical attrition of NOR-rDNAs in senescent WS-MSCs. (A) SIM images showing mCherry-TTALErDNA-labeled NOR-rDNA in WS-MSCs and WT-MSCs. NLS-EGFP was co-expressed to monitor transfection efficiency. Dashed lines indicate the nuclear boundary. Scale bars, 5 μm. (B) Intensity profiles of TTALErDNA signals across the solid lines (10 μm in length) in A. (C) Histogram showing fluorescence intensity of mCherry-TTALErDNA normalized by that of NLS-GFP in A. n = 50 nuclei; ***P < 0.001. (D) Quantitative FISH (FACS) analysis of NOR-rDNA in WS-MSCs and WT-MSCs. Left panel: primary result of FACS. Right panel: histogram showing lower average intensity of NOR-rDNA FISH signal in WS-MSCs compared with WT-MSCs. Data are presented as mean ± SEM; n = 3; ***P < 0.001. (E) Quantitative PCR analysis showing diminished rDNA copy numbers in WS-MSCs relative to WT-MSCs. Data are presented as mean ± SEM; n = 3; **P < 0.01. (F) qPCR analysis of of telomere length (left) and NOR-rDNA copy number (right) in the genomic DNA of peripheral blood samples collected from young and old donors. n = 8 (young donors) or 9 (old donors); ***P < 0.001; *P < 0.05.

