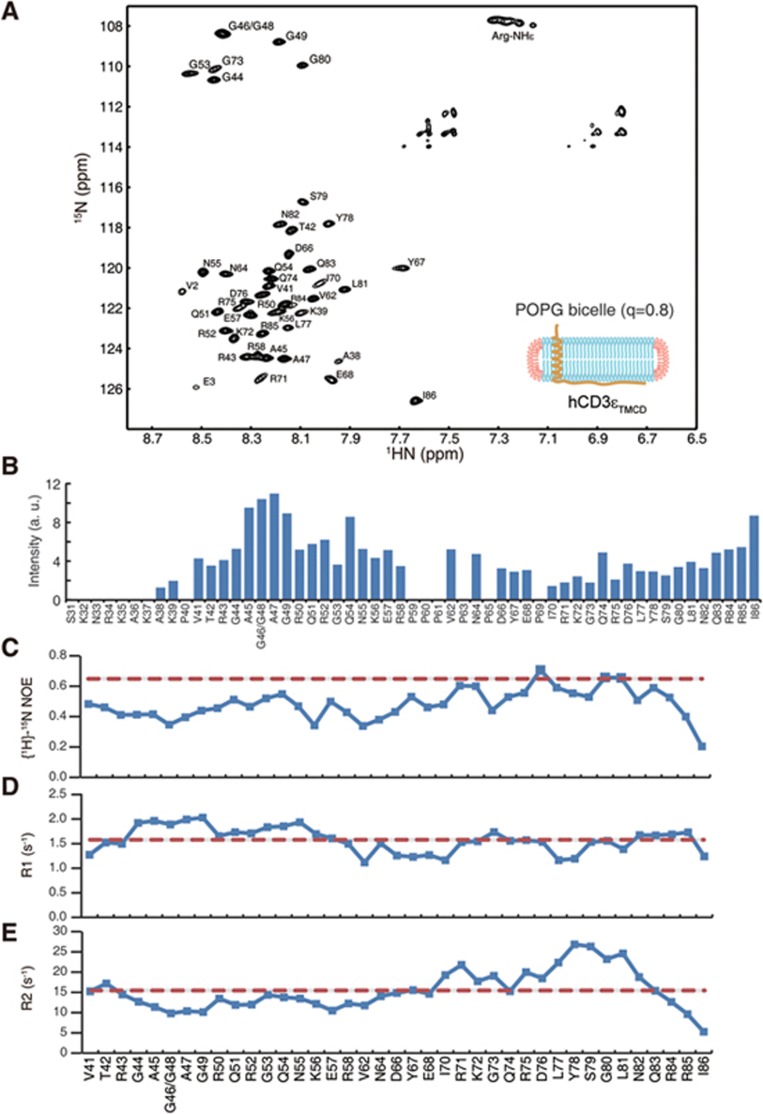
Figure 4.
Dynamic feature of the lipid-bound CD3ε cytoplasmic domain. (A) A high-resolution 1H-15N TROSY spectrum of hCD3εTMCD reconstituted in big POPG bicelle (q = 0.8). (B) Signal intensities of backbone amide resonances of hCD3εTMCD construct. The good signals from residues in the cytoplasmic domain indicated that this region had substantial motion. (C-E) The three 15N spin relaxation parameters, including steady-state heteronuclear {1H}-15N NOEs (C), longitudinal spin relaxation rate R1 (D) and transverse spin relaxation rate R2 (E), were plotted as histograms vs the residue number. The {1H}-15N NOE values showed variations in the range of 0.20-0.71 with an average of 0.48. In general, flexible residues give {1H}-15N NOE values less than 0.65 (the red dash line). R1 values showed relatively little variation (1.12-2.03 s−1), with an average value of 1.58 s−1 (the red dash line). Such a large R1 value usually implied larger internal motions. R2 values were generally small, also indicating fast internal motion. R2 values showed a larger variation (5.27-26.84 s−1), giving an average value of 15.46 s−1 (the red dash line). The C-terminal sequence had R2 values larger than average, suggesting the presence of conformational exchange in this region.

