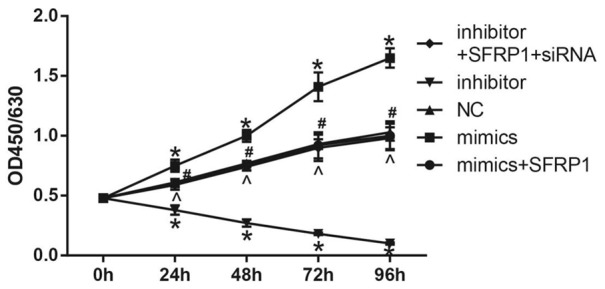
Figure 6.

Comparison of the proliferation ability of GC cells among the five groups. Note: *, P < 0.05, compared with the NC group; #, P < 0.05 compared with the miR-27a mimics group; ^, P < 0.05, compared with the miR-27a inhibitor group. GC, gastric cancer; miR-27a, microRNA-27a; NC, negative control group.
