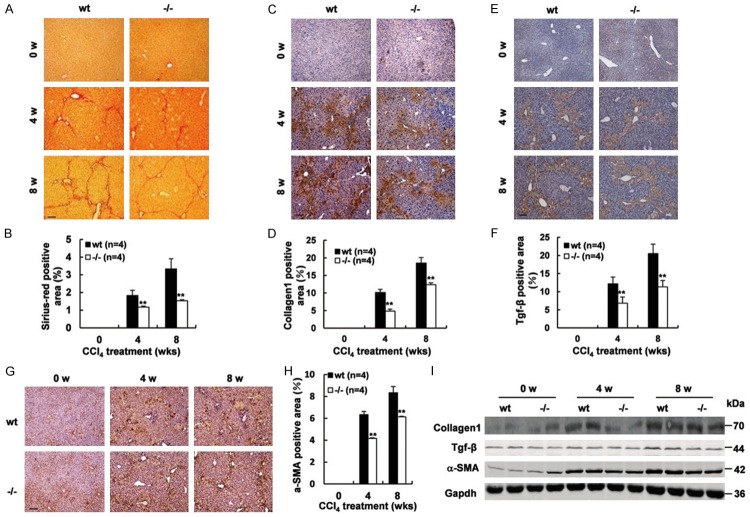
Figure 2.
Deletion of Gpr110 caused less evident liver fibrosis and HSC activation upon chronic CCl4 challenges. (A, B) Mice were treated with CCl4 for 0, 4 and 8 weeks (n=6). Siriusred staining sections from 0-, 4- and 8 weeks after the CCl4 injection-sacrificed Gpr110-/- mice and wild-type littermate mice liver (100×) (A). Scalebar, 100 μm. Percentage of Sirius red positive area were quantified with the ImageJ software and statistical analyzed (B). Values are presented as mean ± SD. *P<0.05; **P<0.01. (C, D) Immunostaining of Collagen1, sections from 0-, 4- and 8 weeks after the CCl4 injection -sacrificed Gpr110-/- mice and wild-type littermate mice liver (100×) (C). Scalebar, 100 μm. Percentage of collagen1 positive area were quantified with the ImageJ software and statistical analyzed (D). Values are presented as mean ± SD. *P<0.05; **P<0.01. (E, F) Immunostaining of Tgf-β, sections from 0-, 4- and 8 weeks after the CCl4 injection-sacrificed Gpr110-/- mice and wild-type littermate mice liver (100×) (E). Scalebar, 100 μm. Percentage of Tgf-β positive area were quantified with the ImageJ software and statistical analyzed (F). Values are presented as mean ± SD. *P<0.05; **P<0.01. (G, H) Immunostaining of α-SMA, sections from 0-, 4- and 8 weeks after the CCl4 injection-sacrificed mice liver (100×) (G). Scalebar, 100 μm. Percentage of Tgf-β positive area were quantified with the ImageJ software and statistical analyzed (H). Values are presented as mean ± SD. *P<0.05; **P<0.01. (I) Western blot analysis of Collagen1, Tgf-β and α-SMA in 0-week, 4-week and 8-week CCl4-treated Gpr110-/- mice and wild-type littermate mice liver.

