Figure 1.

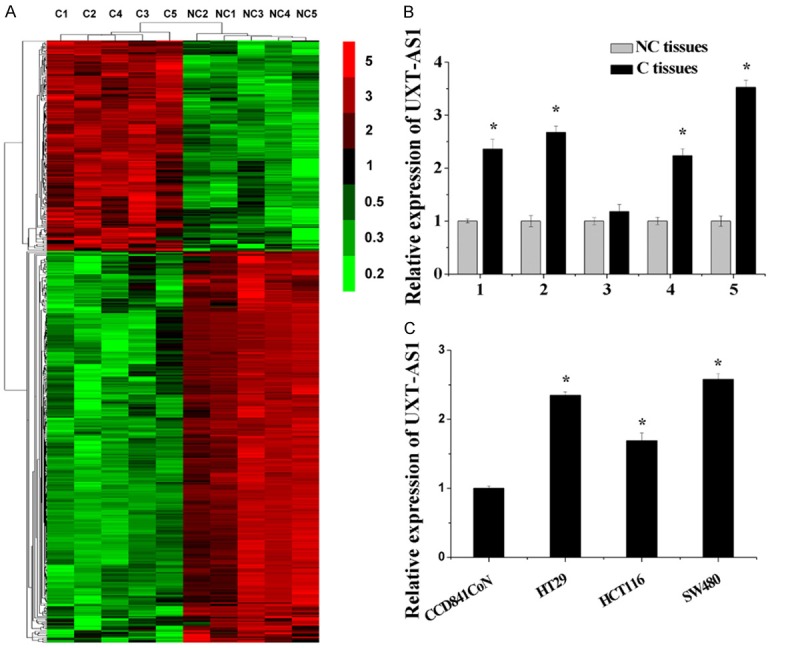
UXT-AS1 was upregulated in CRC. A. Clustering of lncRNAs in five pairs of CRC samples (carcinoma tissues: C and paracarcinoma tissues: NC). The vertical axis corresponds to the expression difference in lncRNAs. The expression levels of lncRNAs are depicted by color variation from red (high expression) to green (low expression) according to the color bar scale. B. Upregulation of UXT-AS1 in microarray experiments was validated by RT-PCR analysis. C. The expression level of UXT-AS1 in one normal colonic epithelial cell line CCD841CoN and three human colonic carcinoma cell lines HT29, HCT116 and SW480. (n = 3, *P < 0.05).
