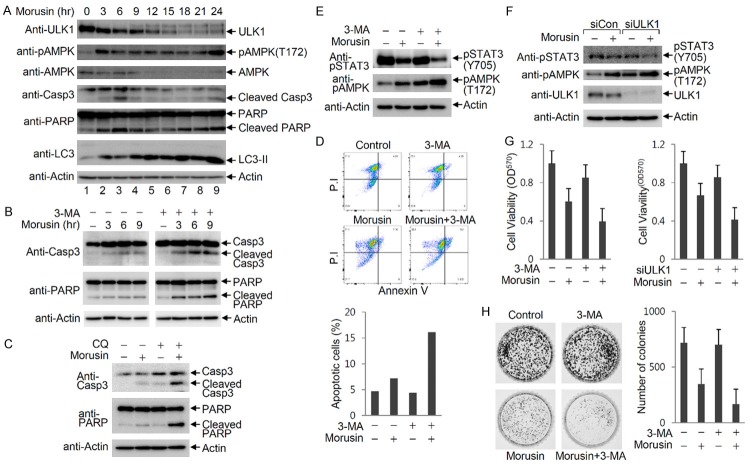
Figure 5.
Morusin-induced autophagy enhances cell survival by inhibition of cell death. (A) Time-course induction of autophagy and apoptosis by morusin. HeLa cells were treated with morusin (30 uM), and cells were collected at the indicated time points for immunoblotting. (B and C) Induction of morusin-mediated apoptosis in the absence of autophagy. HeLa cells were treated with morusin (30 uM), and cells were collected at the indicated time points for immunoblotting in the presence or absence of 3-MA (B) or CQ (C). (D) Analysis of morusin-induced apoptosis using fluorescence-activated cell sorting (FACS) analysis. HeLa cells were treated with either morusin alone or in combination with 3-MA, and apoptotic cells were assessed by FACS analysis after annexin V-FITC and propidium iodide (PI) staining. Apoptotic cells (double-positive for PI and annexin V) are presented on the graph. (E) Inhibition of STAT3 signaling upon combined treatment of morusin and 3-MA. The levels of STAT3 phosphorylation at Tyr705 and AMPKα phosphorylation at Thr172 in cells treated with both morusin and 3-MA were compared to levels in cells treated with either drug alone. (F) Inhibition of STAT3 signaling upon ULK1 depletion and morusin treatment. The levels of STAT3 phosphorylation at Tyr705 and AMPKα phosphorylation at Thr172 in cells subjected to both morusin treatment and ULK1 depletion were compared to levels in cells either treated with morusin or depleted of ULK1. (G) Reduction of cell viability by blocking morusin-induced autophagy. HepG2 cells were treated with morusin and/or 3-MA, and cell viability was determined by measuring MTT metabolic activity. Mock-depleted and ULK1-depleted HeLa cells were treated with either DMSO or morusin, and subjected to the MTT assay. Data are presented as the mean ± SEM. (H) Inhibition of colony formation by blocking morusin-induced autophagy. Cells were treated with morusin and/or 3-MA, and the number of colonies were counted following staining of cells with Coomassie Brilliant Blue. The number of colonies obtained from three independent experiments are presented as a graph. One representive image is shown. Data are presented as the mean ± SEM.

