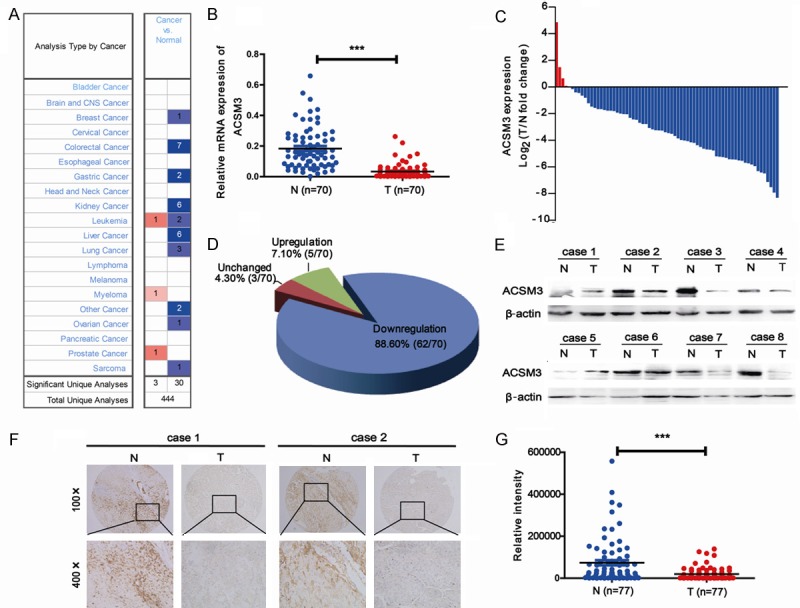
Figure 1.

Downregulation of ACSM3 in HCC tissues. A: Downregulation of ACSM3 was shown in Oncomine database. B-D: mRNA levels of ACSM3 were detected in 70 paired samples of tumorous (T) tissues and corresponding adjacent nontumorous (N) liver tissues from HCC patients by quantitative real-time PCR. E: Protein levels of ACSM3 were detected in 8 paired samples of tumorous (T) tissues and corresponding adjacent nontumorous (N) liver tissues from HCC patients by western blot. F, G: IHC staining of ACSM3 in a microarray includes 77 paired samples of tumorous (T) tissues and matched adjacent nontumorous (N) liver tissues. Integrated optical density (IOD) for ACSM3 was obtained for analysis. ***; P<0.001.
