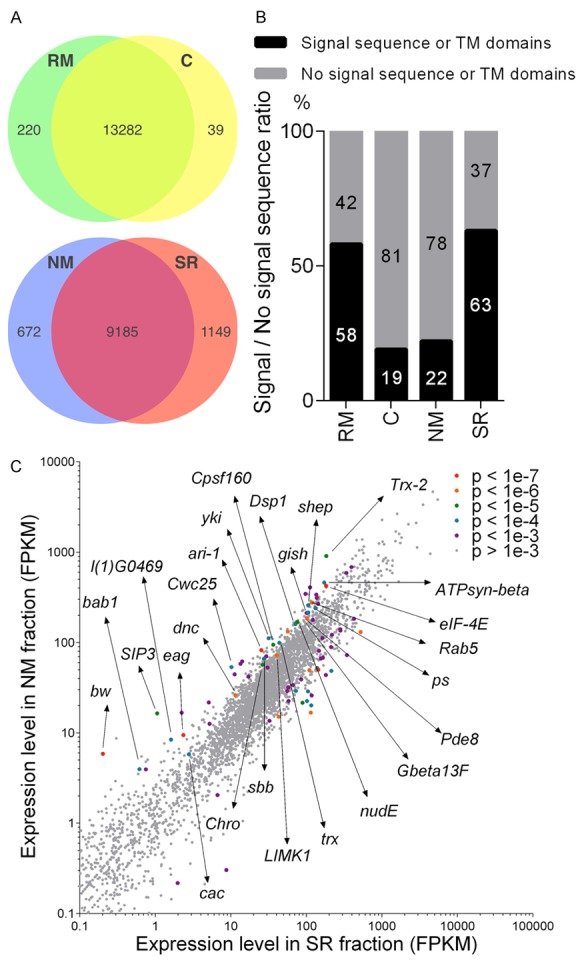
Figure 2.

RNA-seq analysis of mRNAs in RM, C, NM or SR fractions. A. Numbers of identified mRNAs in RM, C, NM and SR, respectively. Similar numbers of transcripts were detected in the RM and C fractions and within the NM and SR fractions. B. The percentage of mRNAs bearing signal sequences (black bar) or not (gray bar) in the 200 most highly enriched transcripts in each fraction. C. Scatter plot showing that mRNAs encoding numerous types of proteins are enriched in NM. All analyses were carried out by using the GSE85768 dataset.
