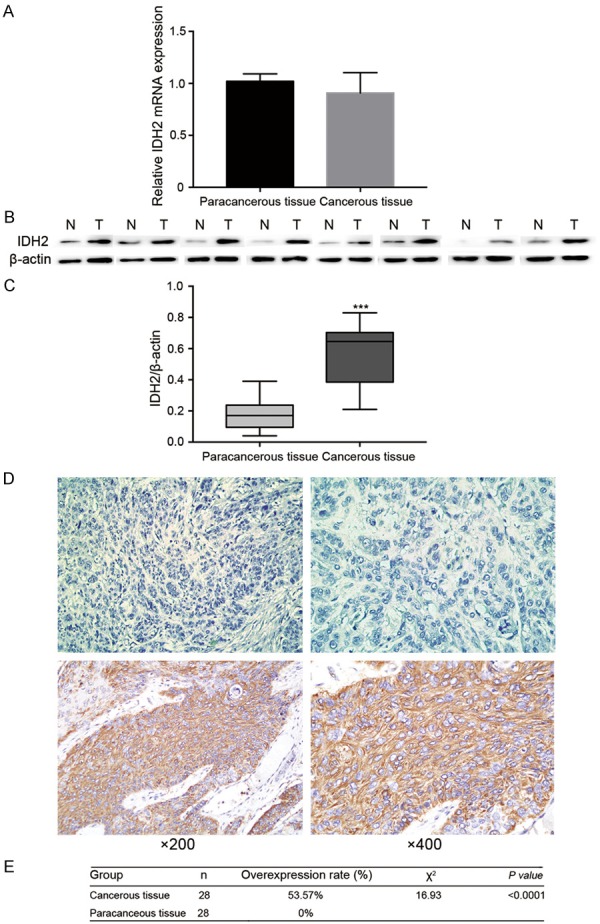
Figure 1.

IDH2 expression in ESCC cancerous and paracancerous tissues from 28 patients. A: IDH2 expression at the mRNA level. B: Western blot bands of 8 pairs of cancerous and paracancerous tissues from ESCC patients. C: IDH2/β-actin values of 8 pairs of ESCC tissues. D: Representative immunostaining of IDH2 in ESCC tissues: the upper ESCC tissue did not overexpressed IDH2, while the lower ESCC tissue overexpressed IDH2. E: Comparison of the results of the IHC analysis of cancerous and paracancerous tissues.
