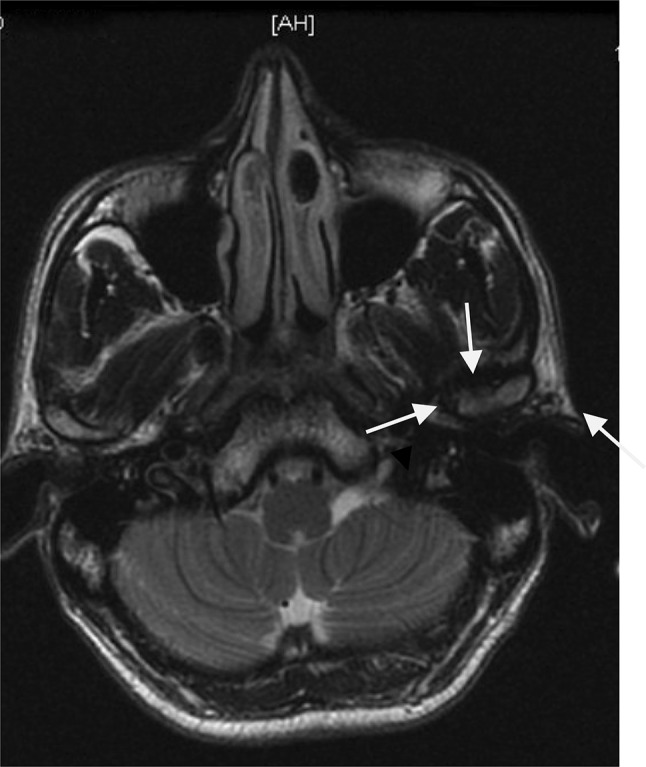
Fig. 4.

Arrows pointing at the fibrosis (reduced signal intensity) seen in the pericapsular tissues of the left TMJ as compared to the right TMJ in a patient who received two sessions of prolotherapy. The MRI was taken after 1 year from last injection
