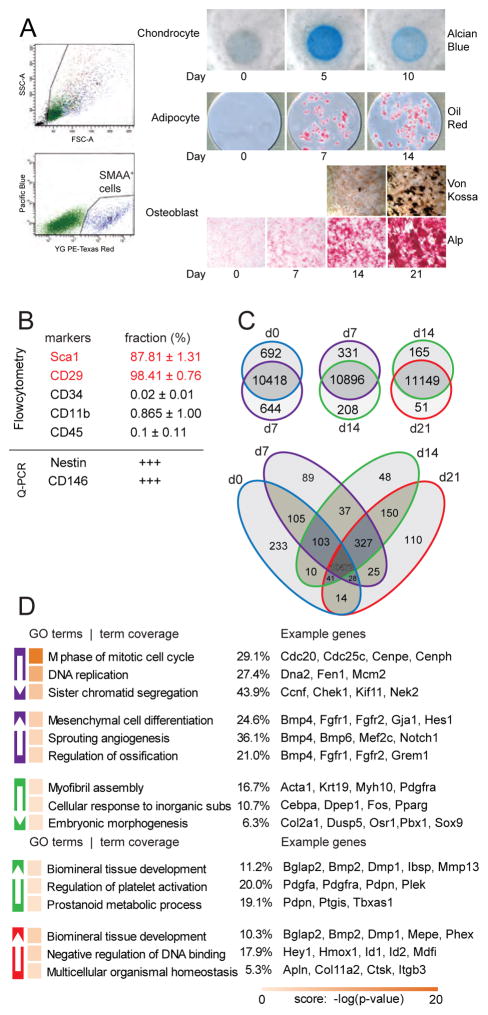
Figure 1. Gene expression dynamics during MSC osteoblast differentiation.
A) Primary BMSCs were isolated the diaphyses of tibia and femur of transgenic SMAA-mCherry+ mice and sorted by FACS for mCherry expression. Sorted MSCs were induced to chondrogenic, adipogenic and osteoblastic differentiation, and monitored by histological staining for proteoglycan deposition (alcian blue; top panels); lipid deposition (Oil Red O; middle panels); mineral deposition (Von Kossa, lower panels) and Alp activity (bottom panels). B) SMAA+ MSC were characterized for phenotypic markers by flow cytometry or qPCr for gene expression. Values are expressed as fraction of total events (Flow cytometry) or relative expression to bulk MSC population (pPCR). C) Differentially expressed genes (DE genes) were compared between time points. Numbers of genes downregulated, unchanged, and upregulated at the latter time point are listed from top to bottom. Pair-wise comparisons of all expressed genes (with at least 1 FPKM at one or more time points) during osteoblastic differentiation at indicated time points. Commonly expressed genes (10472) are highlighted in red at the center of the Venn diagram. C) Genes were functionally annotated into GO terms with both downregulated and upregulated genes using the ClueGO package. Enriched GO terms are ranked by score. Term coverage (number of matched genes / total number of genes in a term) and example genes are shown.

