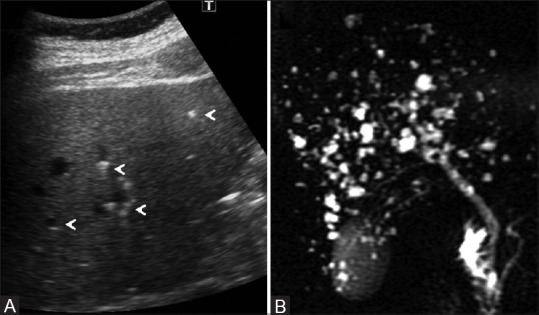
Figure 4 (A and B).

Von Meyenburg complexes. (A) Abdominal ultrasound images showed scattered hyperechoic and hypoechoic submillimetric lesions in liver showing comet-tail echoes (arrowheads); (B) thick-section single shot fast spin-echo heavily T2-weighted MR image shows no communication with biliary tree
