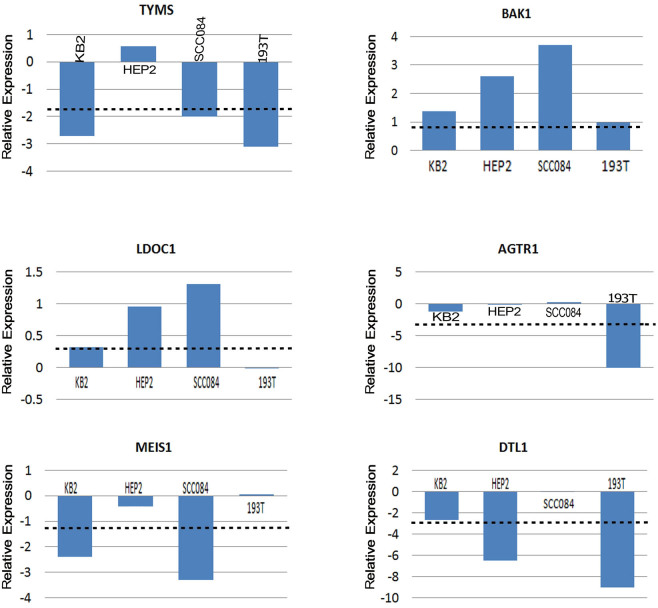
Figure 6. Graph derived from qRT-PCR Analysis: Quantitative RT-PCR analysis showing reduced/increased expression of TYMS, BAK1, LDOC1, AGTR1, MEIS1 and DTL1 samples in KB2, HEP2, SCC084 cell line and one HNSCC primary tumor sample.
Bars represent the gene expression normalized to b2-microglobulin and relative to a pool of normal oral tissues. The line illustrates the mean reduction level of respective genes. X-axis indicates samples.

