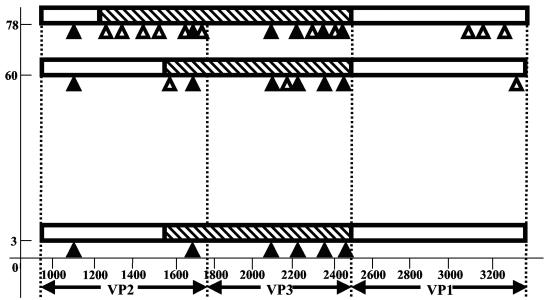
FIG. 3.
Schematic representation of proposed evolution of the patient isolates. Genomic regions coding for the major capsid proteins are presented schematically. Genomic parts originating from proposed older type 2 vaccine derivative are marked by hatched bars; younger Sabin 2 derivative sequences are presented by empty bars. Only approximate positions of the borders between the older and younger segments can be given. The synonymous mutations accumulated are shown by triangles placed under bars; closed and open symbols correspond to common mutations and mutations characteristic of a single isolate, respectively. x axis, nucleotide position numbering; y axis, days after paralysis onset.

