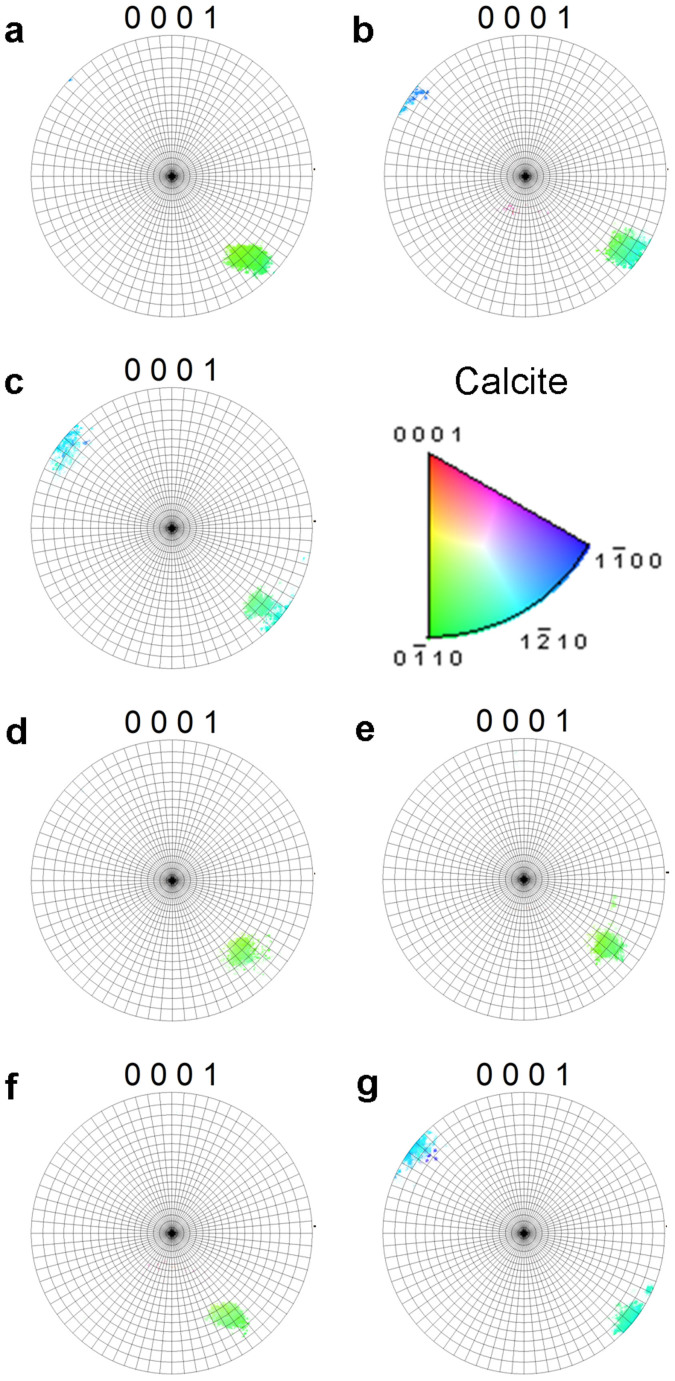
Figure 2. Electron Back Scatter Diffraction (EBSD) crystallographic orientation calcite pole figure diagrams indicating the orientation angle of the calcite in the electron back scatter diffraction (EBSD) images (a) 380 µatm, (b) 380 µatm 12°C, (c) 550 µatm, (d) 750 µatm, (e) 750 µatm 12°C, (f) 1000 µatm, (g) 1000 µatm 12°C.
Pole figures correspond to the calcite crystallographic orientation map colour key, gridlines represent 5° divisions of angular orientation. Note differences in the clustering and spread of the EBSD data provide information on the variability of the calcite crystal angles.

