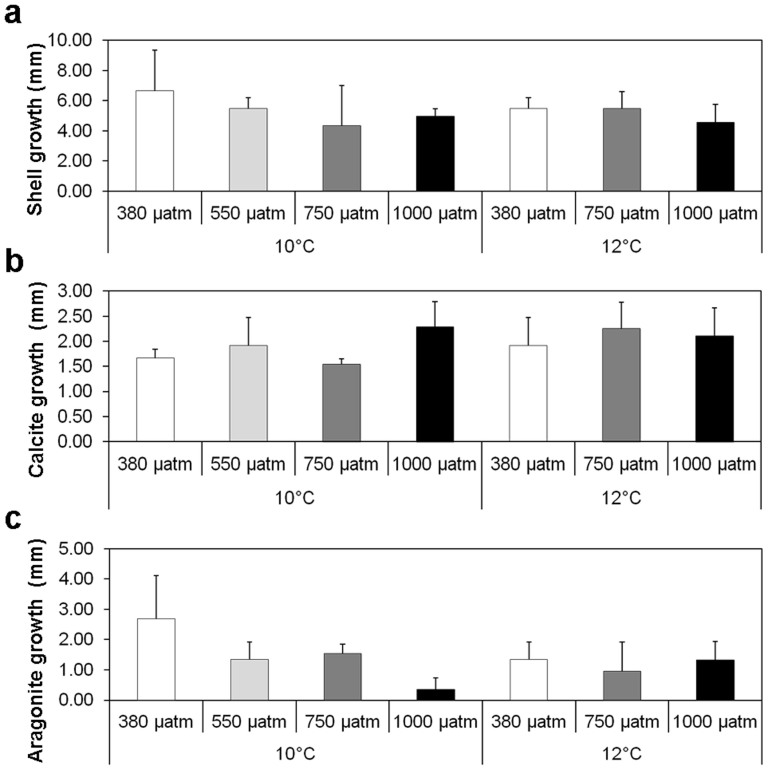
Figure 4. Shell growth at 6 months experimental culture (mm).
(a). Shell length increase for each pCO2 and temperature. Error bars represent one standard deviation (n = 4). (b). Calcite growth (mm) in mussel shells cultured for 6 months for each pCO2 and temperature. Error bars represent one standard deviation (n = 4). (c). Aragonite growth (mm) in mussel shells cultured for 6 months for each pCO2 and temperature. Error bars represent one standard deviation (n = 4).

