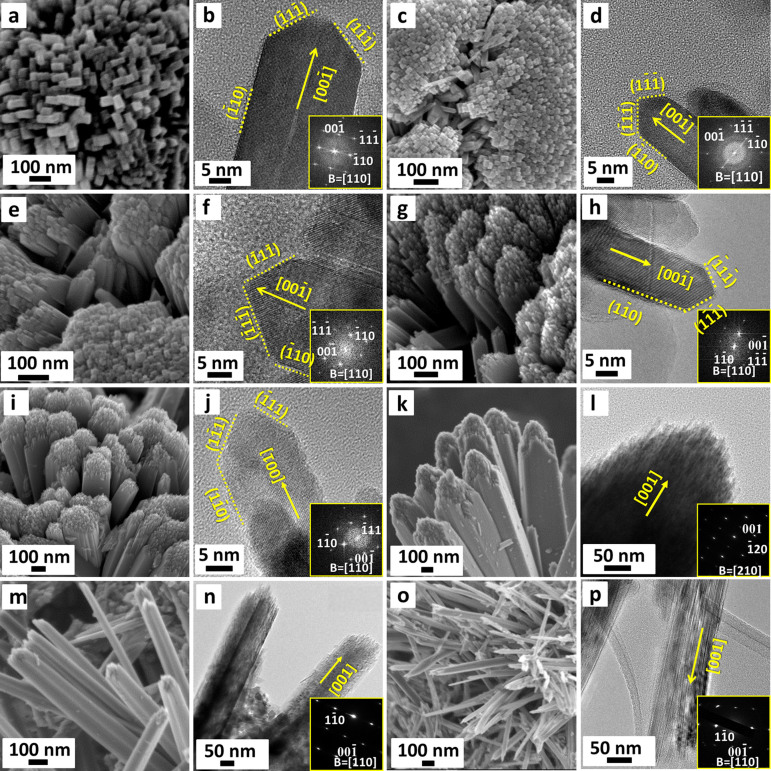
Figure 2. (a, c, e, g, i, k, m, o) High-magnification SEM images of HRT-1 to HRT-8, respectively; (b, d, f, h, j) TEM images of individual nanorods; (l, n, p) TEM images of nanorod bundles.
The insets of (b, d, f, h, j, l, n, p) are the corresponding FFTs (b, d, f, h, j) and electron diffraction patterns (l, n, p).

