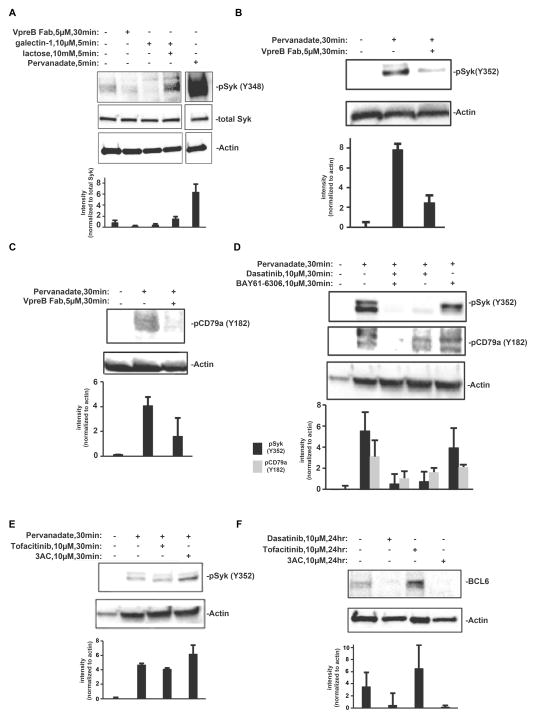
Fig. 4. Western blotting analysis of pre-BCR signaling.
(A) Western blotting analysis of Nalm6 cell lysates (3 × 10⁷cells) for Syk phosphorylation at Tyr348 (pSyk Y348) after the indicated treatments. Blots were stripped and incubated with antibodies against total Syk and actin. Note that the pervanadate lane is shown after gray scale adjustment of the digital image, to adjust for the intensity of the signal for pSykY348 compared to that in resting cells and after treatment with inhibitors. (B and C) Western blotting analysis of 697 cells (1.0 × 10⁶) with antibodies specific for pSyk and pCD79a (Igα) after the cells were treated for 30 min with anti-VpreB Fab in the presence of pervanadate. (D) Western blotting analysis of 697 cells (1.0 × 10⁶) with antibodies against pSyk and pCD79a (Igα) after the cells were treatment with BAY61-3606 (Syk inhibitor) or dasatinib (Lyn and Abl inhibitor) in the presence of pervanadate. (E) Western blotting analysis of 697 cells (1.0 × 10⁶) with antibody specific for pSyk after the cells were treated for 30 min with 3AC (SHIP inhibitor) or tofacitinib (Jak inhibitor) in the presence of pervanadate. (F) Western blotting analysis of 697 cells (1.0 × 10⁶) with antibody specific for total BCL6 protein after the cells were treated for 24 hours with dasatinib, tofacitinib, or 3AC. All blots are representative of three or more independent experiments. Accompanying bar graphs report total densitometry data for all experiments for a given condition, with the abundance of the protein of interest normalized to that of actin or total Syk.

