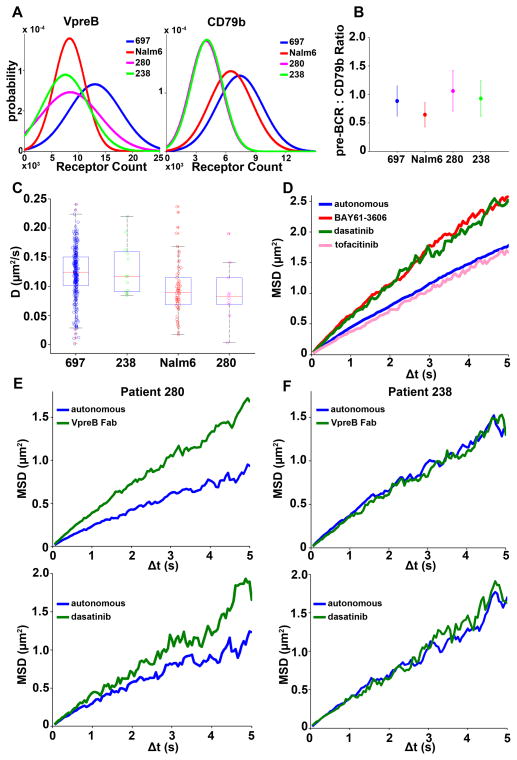
Fig. 6. Expression profile and single particle tracking of pre-BCRs on different primary BCP-ALL cells.
(A) Comparison of the cell surface abundances of VpreB and CD79b (Igβ) on 697 cells, Nalm6 cells, and blasts from patients #238 and #280, as a readout of pre-BCR on the membrane of BCP-ALL cells. Cells were incubated with saturating concentrations of labeled fluorophore-conjugated anti-VpreB or anti-CD79b antibodies and binding values were quantified by flow cytometry. Results were calibrated by saturation binding of each antibody to Simply Cellular anti-mouse IgG microspheres. Data are representative of at least three independent experiments. (B) Comparison of the mean fluorescent values after anti-VpreB and anti-CD79b labeling of the indicated cell types, plotted as a ratio of pre-BCR (2 VpreB = 1 pre-BCR) to CD79b. (C) Comparison of the diffusion coefficient (μm2/s) of the pre-BCR in 697 cells (n = 26,447 trajectories) and Nalm6 cells (n = 3,573 trajectories) to primary cells from patient 238 (304 trajectories) and patient 280 (353 trajectories); single particle tracking was performed on untreated cells in all cases and performed over multiple days. (D) Ensemble MSD plots derived from SPT of the pre-BCR on 697 cells with or without a 10-min treatment with the indicated tyrosine kinase inhibitors. (E) Ensemble MSD plots derived from SPT of the pre-BCR on the surface of primary cells from patient 280 with and without a 10-min treatment with dasatinib (1 μM) or anti-VpreB Fabs (1 μM). (F) Ensemble MSD plots derived from SPT of the pre-BCR on the surface of primary cells from patient 238 with and without a 10-min treatment with dasatinib (1 μM) or anti-VpreB Fabs (1 μM). Data in (D) to (F) are representative of xxx independent experiments.

