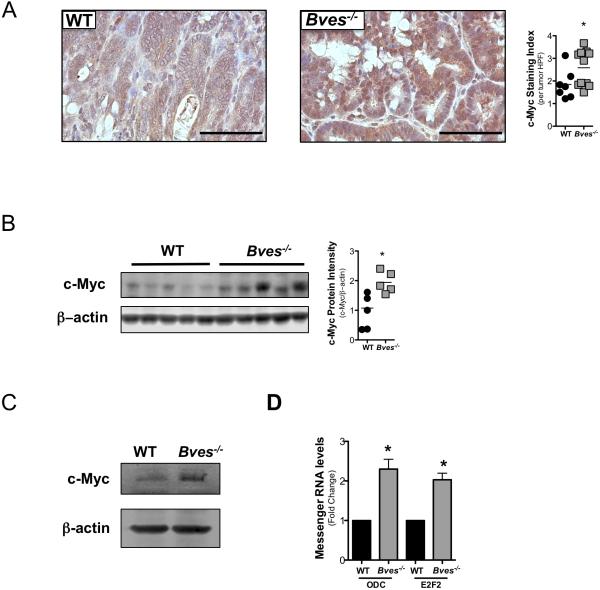
Figure 4. c-Myc signaling is dysregulated in Bves−/− mice in inflammatory carcinogenesis.
(A) Left: Representative images of immunohistochemistry for intratumoral c-Myc. Right: quantification of c-Myc positive cells per tumor high power field (HPF). HPFs were scored according to an index from 1-4 (a score of 1 denotes less than 25% of positive cells per HPF; a score of 2 denotes 25-50%; a score of 3 denotes 50-75%; a score of 4 denotes 80-100%). Data is presented as the mean score per tumor HPF per mouse. At least five HPF per mouse were scored. Student's t test, *p<0.05. Size standard=50 microns
(B) Immunoblot of c-Myc in WT and Bves−/− normal adjacent colons. Blots were imaged using the LiCor Odyssey system and quantified using Image Studio analysis. Student's t test, p<0.05.
(C) Immunoblot of c-Myc in WT (n=3) and Bves−/− (n=3) intestinal crypts.
(D) qPCR for Odc and E2f2 in enteroid cultures Student's t test, *p<0.05.
In all western blots, β-actin served as loading control.

