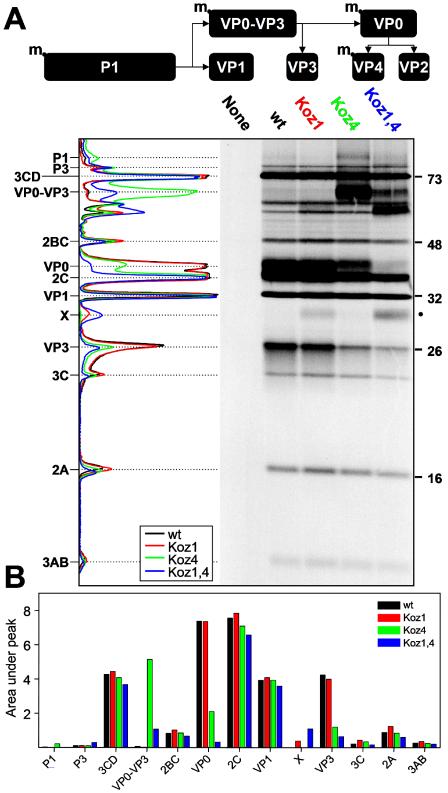
FIG. 5.
In vitro translation of wt RNA, and the three mutant RNAs. In vitro translations were carried out as described in Materials and Methods, and the products were separated on a polyacrylamide gel and then visualized by autoradiography. (A) Diagram of normal P1 processing. m, myristoyl. The RNA templates are shown above the autoradiograph. The four lanes containing input RNA were digitized as described in Materials and Methods, and the four resulting plots are shown to the left of the autoradiograph. The viral proteins are indicated to the left side, and molecular masses are indicated to the right in kilodaltons. The novel band X with a molecular mass of ∼29.7 kDa is highlighted by a dot to the right of the autoradiograph. (B) To more precisely quantify the proteins generated by in vitro transcription, the four digitized plots shown in panel A were analyzed as described in Materials and Methods. The areas under the peaks were determined and are shown (in arbitrary units) for the indicated viral proteins.

