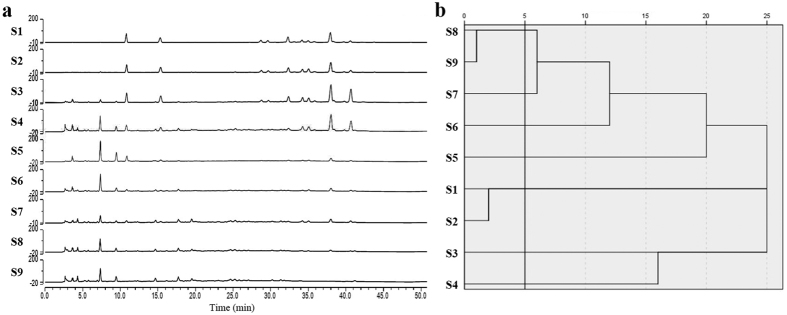
Figure 3. UPLC fingerprints analysis of nine DHI modified samples.
(a) The UPLC fingerprints of nine DHI modified samples were detected at 288 nm wavelength. Thirteen main common peaks were identified based on the results of UFLC-PDA-Triple TOF-MS/MS analysis. (b) Cluster analysis results of DHI modified samples. Given the rescaled distance of 5, nine samples could be divided into 7 classes: S1 & S2, S3, S4, S5, S6, S7, S8 & S9.

