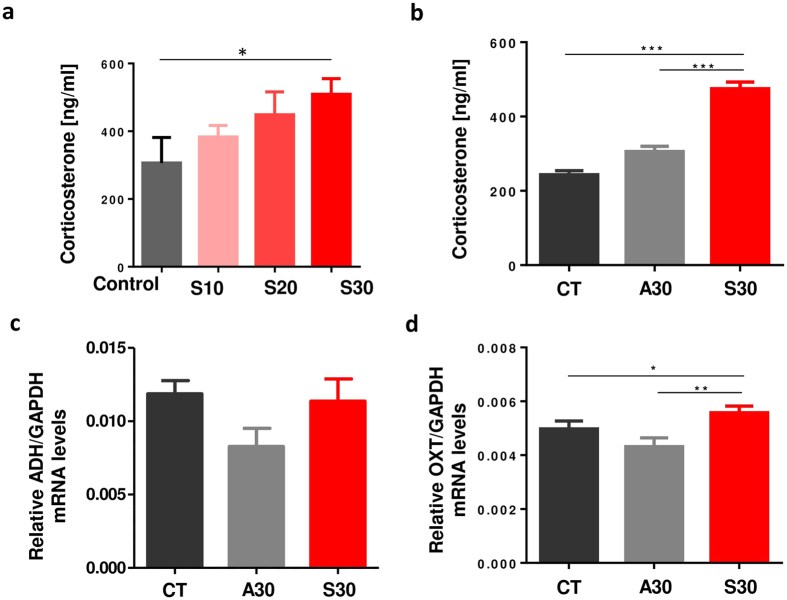
Figure 1. Levels of corticosterone, vasopressin and oxytocin in mice.
(a) Levels of corticosterone in 6-week old mice (4 mice per each group) that consumed plain water, 10 w/v%, 20 w/v% or 30 w/v% sucrose solution for 2 weeks were determined by ELISA. (b) Levels of serum corticosterone following consumption of sucrose solution, aspartame solution, or plain water for 8-week (8–9 mice per each group). (c,d) Relative mRNA expression level of ADH (c) and oxytocin (d) in mice following consumption of plain water, sucrose solution or aspartame solution for 8-week were determined by qPCR. The expression of each gene was normalized to GAPDH. All data are presented as mean ± S.E.M. Mann-Whitney U test was performed to determine significant difference in S30 compared with CT or A30. *p < 0.05, **p < 0.01, ***p < 0.001.

