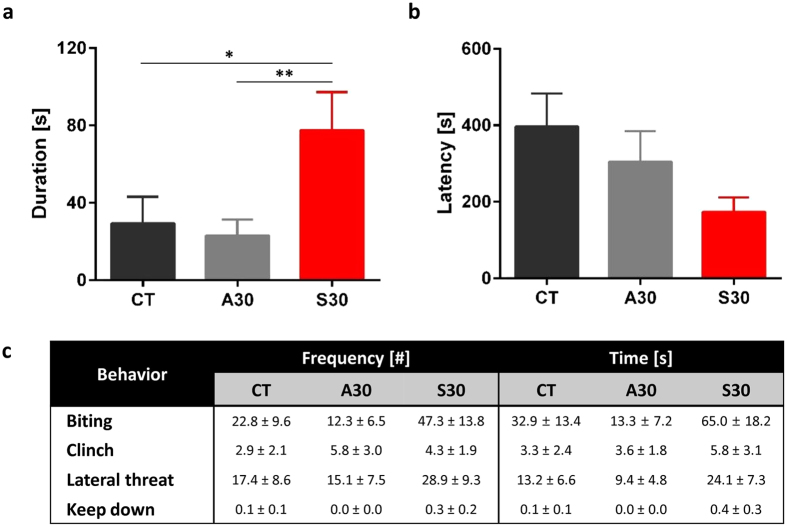
Figure 2. Aggressive behaviors in adult mice.
(a) Latency ([s]; [seconds]) to show the time of first attack performed by resident mice against intruders following consumption of sucrose solution, aspartame solution, or plain water for 8-week. (b) Duration ([s]; [seconds]) to show the total time of all aggressive behaviors. (c) Frequency (the number of attacks) and time (total time of each aggressive behavior) of aggressive behaviors. All data are presented as mean ± S.E.M. P-values were generated by Mann-Whitney U test to determine significant difference in S30 compared with CT or A30. *p < 0.05, **p < 0.01, ***p < 0.001.

