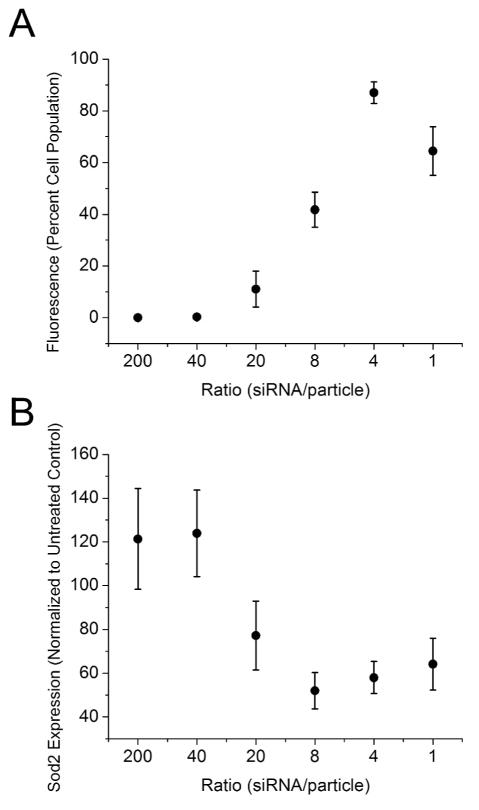
Figure 5.
Uptake of cESG-siRNA correlates with Sod2 protein expression knockdown. A) Uptake of cESG-siRNA was quantified as the percentage of cells which display fluorescence signals (at least 50 cells/image, n=3 images, analyzed and counted in three independent experiments, data represent mean +/− SEM). B) Sod2 protein expression was determined by western blotting 72 hrs after treatment with cESG-siRNA complexes (Figure S5). Expression was quantified by densitometry and normalization to the loading control β-actin and untreated control cells (n=3).

