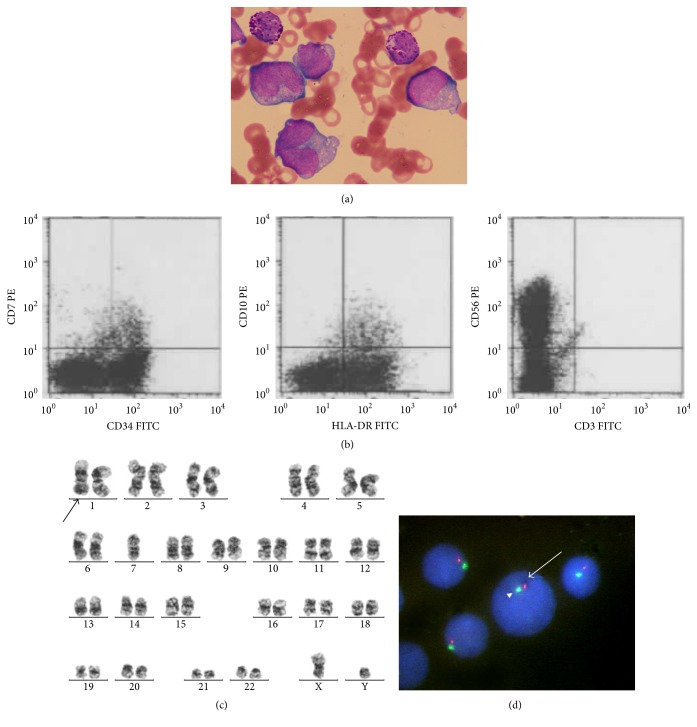
Figure 2.
The characterization of myeloblasts in bone marrow. (a) Bone marrow smear showed some large-sized myeloblasts with clear nucleoli, basophilic cytoplasm, and some vacuoles. Some mature basophils were observed (May-Giemsa staining, original magnification, ×1000). (b) Flow cytometric analysis showed blasts positive for CD34, CD56, and HLA-DR. (c) Chromosomal analysis by G banding showed 45, XY, -7 [5]/45, idem, add(1)(q21) [4]/46, XY [2]. (d) Dual-color FISH analysis using chromosome 7 probes showed that myeloblasts contained one red signal and one green signal, which indicated monosomy 7 (D7S486 probe, red signal, arrow; D7Z1 probe, green signal, arrow head).

