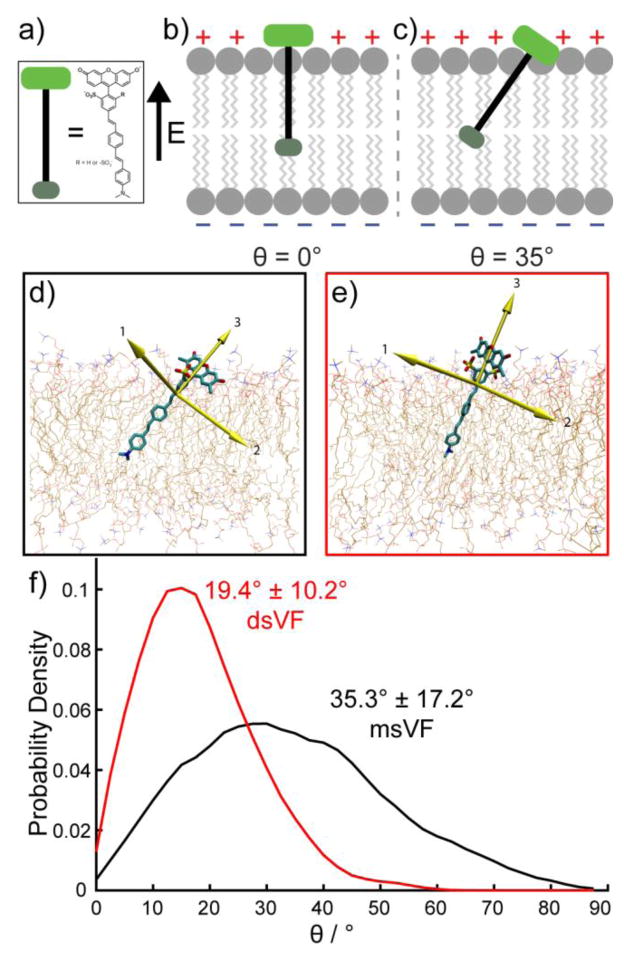
Figure 1.
Orientation of ms and ds VF dyes. Schematic representation of a)VF dye alignment in the plasma membrane. b) Maximum voltage sensitivity is predicted when theta = 0° (left) and is lowest when theta = 90° (not shown). c) Intermediate values of theta (right) reduce voltage sensitivity. Snapshots of MD simulations in POPC lipid bilayers show d) msVF and e) dsVF. Yellow arrows indicate principal components. f) Plot of probability density vs. angle of displacement between the 3rd principle component (the long axis) of VF dyes and the membrane normal.

