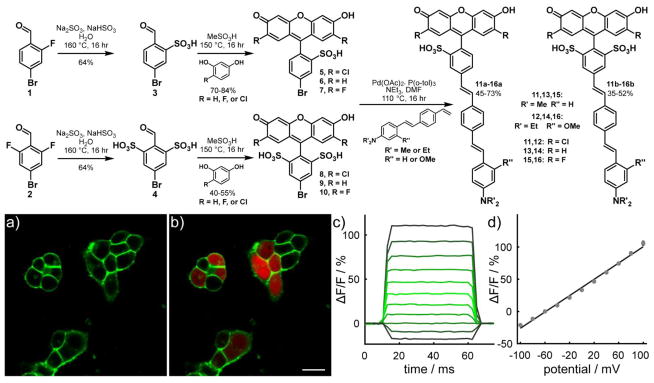
Figure 3.
Synthesis and characterization of monosulfo and disulfoVF dyes. Upper panel: Synthesis of VF dyes. Lower panel: a) Confocal fluorescence images of dsVF2.2(OMe).Cl in HEK cells. Membrane-associated green fluorescence (panel a) shows clear membrane localization when compared with cytosolic mCherry (red, panel b). Scale bar is 20 μm. Membrane-localized dsVF2.2(OMe).Cl is voltage sensitive. c) The fractional change in fluorescence is plotted vs. time for 100 ms hyper- and depolarizing steps (±100 mV, 20 mV increments) from a holding potential of −60 mV for a single HEK cells under whole-cell voltage-clamp mode. d) A plot of % ΔF/F vs. final membrane potential (mV), summarizing data from 8 separate cells, reveals a voltage sensitivity of approximately 63% per 100 mV (±1.6%). Error bars are ±SEM.

