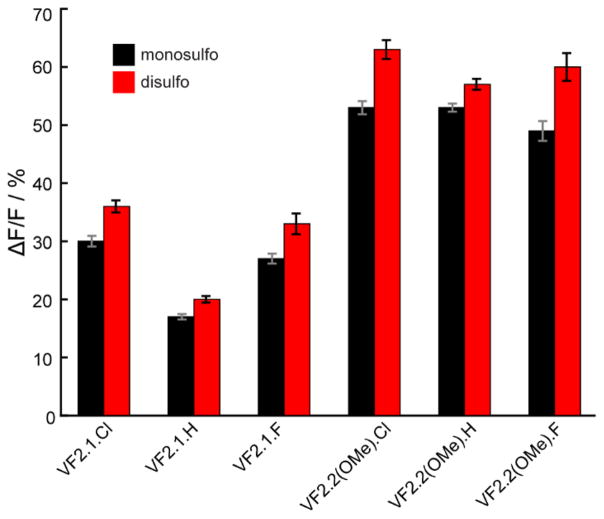
Figure 4.
Comparison of voltage sensitivity of monosulfo- and disulfo-VoltageFluor. Black bars represent msVF dyes and red bars represent dsVF dyes. Voltage sensitivity is reported as ΔF/F per 100 mV as measured in patch-clamped HEK cells. Values represent 3–8 independent determinations and error bars are ±SEM

