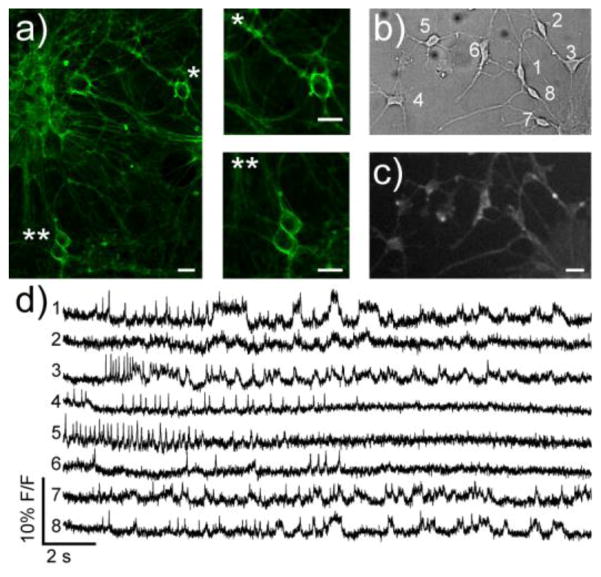
Figure 5.
Imaging membrane potential changes in cultured rat hippocampal neurons and hPSC-derived midbrain dopaminergic (mDA) neurons using dsVF2.2(OMe).Cl. a) Confocal images of rat hippocampal neurons stained with 500 nM dsVF2.2(OMe).Cl. * and ** are zoomed regions of the indicated neurons b) Transmitted light image (DIC) of hPSC-derived mDA neurons. c) Wide field fluorescence image of mDA neurons from panel b stained with 500 nM dsVF2.2(OMe).Cl. d) Fractional change in fluroescence vs. time for cells indicated in panels b. Each trace represents the fluorescence intensity from the indicated cell; all traces have been bleach corrected and are unfiltered. Scale bars are 20 μm.

