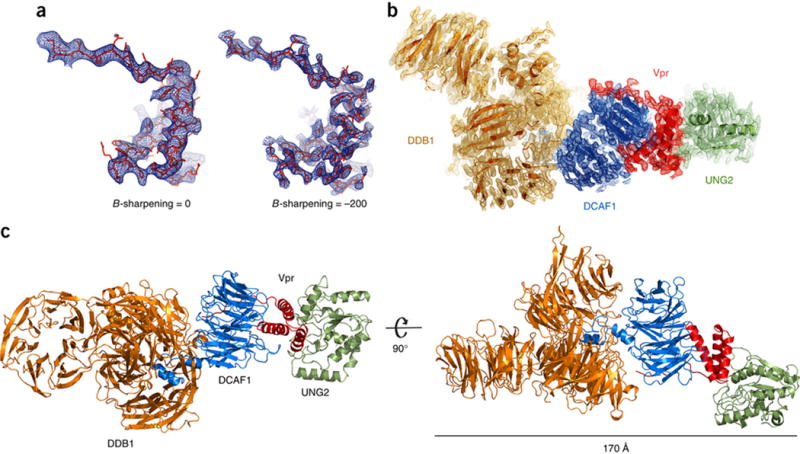
Figure 1. Overall structure of DDB1-DCAF1-Vpr-UNG2 complex.

(A) B-factor sharpening applied to the Fobs-Fcalc electron density map of Vpr in the complex, contoured at 2.5 σ. Use of negative B-factors, in this case −200, resulted in enhanced electron density features, which allowed placement of side-chains58 and refinement of the full structure. The atomic model is shown in red stick representation and the electron density in blue.
(B) The final refined 2 Fobs-Fcalc electron density map of the DDB1-DCAF1-Vpr-UNG2 complex contoured at 1 σ. The individual proteins in the complex are colored: DDB1, orange; DCAF1, blue; Vpr, red; UNG2, green; this color scheme is used throughout the manuscript.
(C) Two views of the overall DDB1-DCAF1-Vpr-UNG2 complex in ribbon representation.
