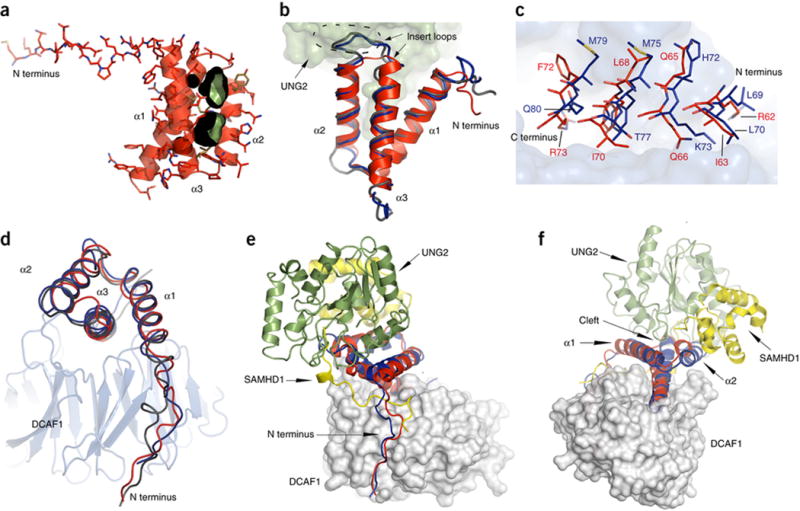
Figure 4. Comparison between Vpr and Vpx structures and their interactions with binding partners.

(A) Ribbon and stick representation of Vpr illustrating the cleft between helices α1 and α2 (rendered in black and green).
(B) Superposition of VprHIV-1 (red, ribbon) in the present complex with UNG2 (green surface representation), VpxMnd (blue worm representation) and VpxSM (silver worm representation) Vpx structures. The insert loops in the Vpx structures are enclosed by a dashed oval.
(C) Close up view of helix α3 residues (VprHIV-1, red; VpxMND, blue) in the DCAF1 binding site. Vpr and Vpx residues are depicted in stick representation and the DCAF1 binding site is shown in gray surface representation.
(D) Best fit superposition of Vpr (red), Vpx (Mnd, blue; SM, silver) structures (worm representation) in complexes with DCAF1 (gray ribbon representation).
(E) – (F) Two views of the superposition of the DCAF1 (gray)-VprHIV-1 (red)-UNG2 (green) and DCAF1 (gray)-VpxMND (blue)-SAMHD1 (yellow) complexes. DCAF1 is show in surface representation and Vpr, Vpx, UNG and SAMHD1 are shown in ribbon representation.
