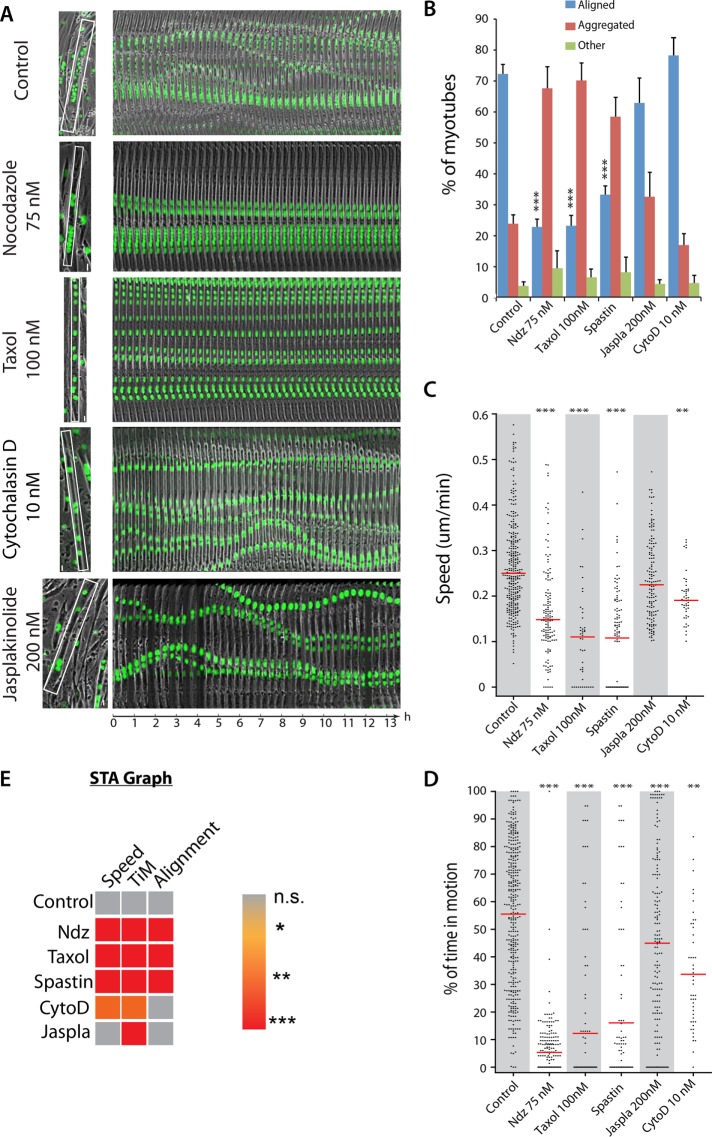
FIGURE 1:
Role of MTs and actin in nuclear movement inside myotubes. (A) Frames from time-lapse two-channel movies (phase contrast and fluorescence) of differentiated GFP-H1-C2 cells in presence or absence of the indicated drugs (Supplemental Movie S1). The first frame of each representative 14-h movie shows a myotube with GFP-H1-C2 nuclei (green); the white rectangle corresponds to the region used to create the adjacent kymograph. (B) Histogram of nuclear distribution analysis in C2C12 myotubes: nontreated (Control), treated with 75 nM nocodazole (Ndz), 100 nM Taxol (Taxol), 200 nM jasplakinolide (Jaspla), or 10 nM cytochalasin D (CytoD), or transfected with GFP-spastin. Nuclear distribution is quantified as “aligned” if >70% of nuclei are aligned along the same axis; “aggregated” if >70% of nuclei do not align along the same axis; and “other” if nuclei are both aggregated and aligned in the same myotube. (C) Speed and (D) percentage of time in motion of nuclei inside C2C12 myotubes 2–3 d old in nontreated (Control), treated with 75 nM Ndz, 100 nM Taxol, 200 nM Jaspla, or 10 nM CytoD conditions or transfected with GFP-spastin. Red line indicates the median. Between 53 (CytoD) and 181 (Ctr) nuclei were monitored from three different experiments. Error bars, SEM. ***p < 0.001, **p < 0.01. (E) STA graph; color is representative of the p value after one-way analysis of variance (ANOVA) statistical test toward a decrease compared to control. ***p < 0.001, **p < 0.01, *p < 0.05.

