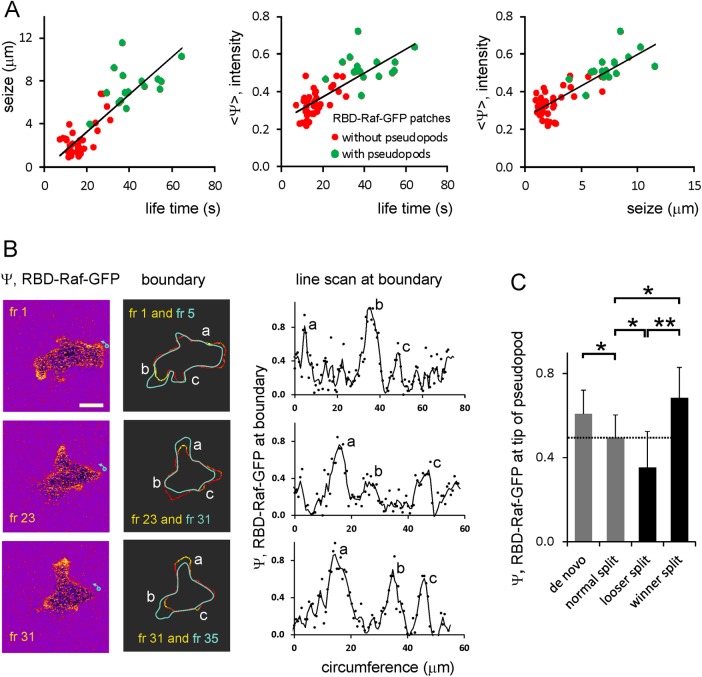
FIGURE 3:
Ras-GTP patches and pseudopod induction. (A) Correlation between size, lifetime, and intensity of Ras-GTP patches. Ras-GTP patches in pseudopodia are larger, live longer, and have a higher intensity than Ras-GTP patches in pseudopod-free areas of the cell. (B) Images (left) and outline (middle) and intensity at boundary (right) of Ras-GTP levels; scale bar, 5 μm. Top, frame 1, shows three major patches; the outline of frame 5 reveals that a protrusion was formed at patch b, which is the strongest Ras-GTP patch of frame 1. Middle, frame 23, shows pseudopod formation at the largest Ras-GTP patch a. Bottom, frame 31, shows a specific case; the strongest Ras-GTP patch a is present in a pseudopod that just stopped its extension, and a new pseudopod starts at the second-largest Ras-GTP patch b. (C) Ras-GFP levels in protrusions at the start of extension. De novo protrusions have more Ras-GTP than splitting protrusions. When a protrusion splits into two extending protrusions, a cell must retract one protrusion to prevent snapping; the data show that the winner protrusion had more Ras-GTP than the loser when they were formed. Data are means and SD of 12 determinations each; significant at *p < 0.05 or **p < 0.01.

