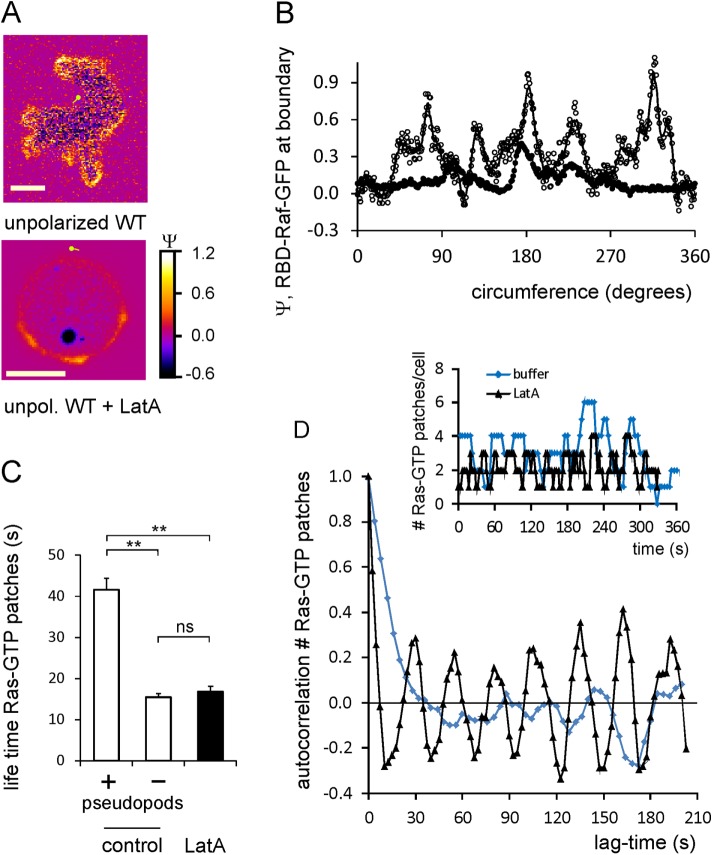
FIGURE 4:
LatA inhibits Ras activation and uncovers a basal excitable Ras activation. (A) Ras-GTP levels of an unpolarized control cell and a cell in the presence of 5 μM F-actin inhibitor LatA; scale bar, 5 μm. (B) Line scan at the boundary of these cells. showing the levels of Ras-GTP; the control cell has approximately five Ras-GTP patches with Ψ ≈ 0.6, whereas the LatA-treated cell has only three Ras-GTP patches with Ψ ≈ 0.3. (C) Lifetime of Ras-GTP patches. In control cells, Ras-GTP patches in pseudopods live much longer than Ras-GTP patches in other areas of the cell. All Ras-GTP patches of LatA-treated cells have a short lifetime. Data show means and SEM with 16, 35, and 28 patches, respectively; significant at **p < 0.01; ns, not significant. (D) Autocorrelation analysis showing periodic Ras-GTP formation in LatA. Inset, number of Ras-GTP patches present in a typical control cell or a cell in LatA. Main graph, autocorrelation of this number at different lag times. Control cells have a relatively long autocorrelation time (time constant of exponential decay of autocorrelation at short lag times; t1/2 = 10.7 s) and no strong oscillations. Cells in LatA have a very short autocorrelation time of t1/2 = 3.4 s, and exhibit very strong oscillations with a periodicity of ∼28 ± 3 s. Data are derived from four cells for each condition.

