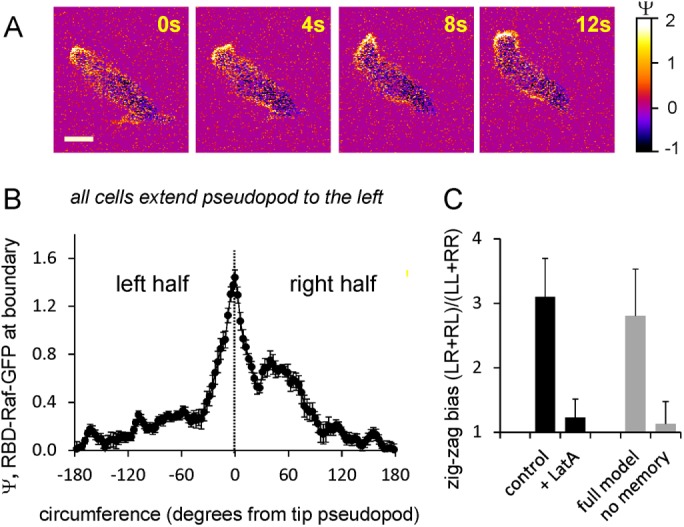
FIGURE 5:

Left–right asymmetry of Ras activation and pseudopod formation. (A) Ras activation in a polarized cell moving to the upper left corner and then extending a splitting to the right. (B) Ras activation at the boundary of 19 cells all extending a pseudopod to the left. The cells have a pronounced Ras-GTP patch at the leading pseudopod but also elevated Ras-GTP levels at the right half of the cell at ∼55°, where the previous and the next pseudopod form. The data are means and SEM with n = 19. (C) Right/left bias. The formation of protrusions (control) or Ras-GTP patches (LatA) was recorded as being to the right or left relative to the previous one. For each triplet of protrusions or Ras-GTP patches, its configuration was identified as RR, RL, LR, or LL. In random movement, (RL + LR)/(RR + LL) is expected to be 1.0, whereas a value >1 indicates a preference for alternating R/L zigzag movement. The data are presented as means and SD of 12 cells each with a track of at least 20 protrusions. The gray bars represent the zigzag bias of P patches in model simulations, either the full model or no memory (k6 = 0). Data are means and SD with 20 simulations during 20 min.
