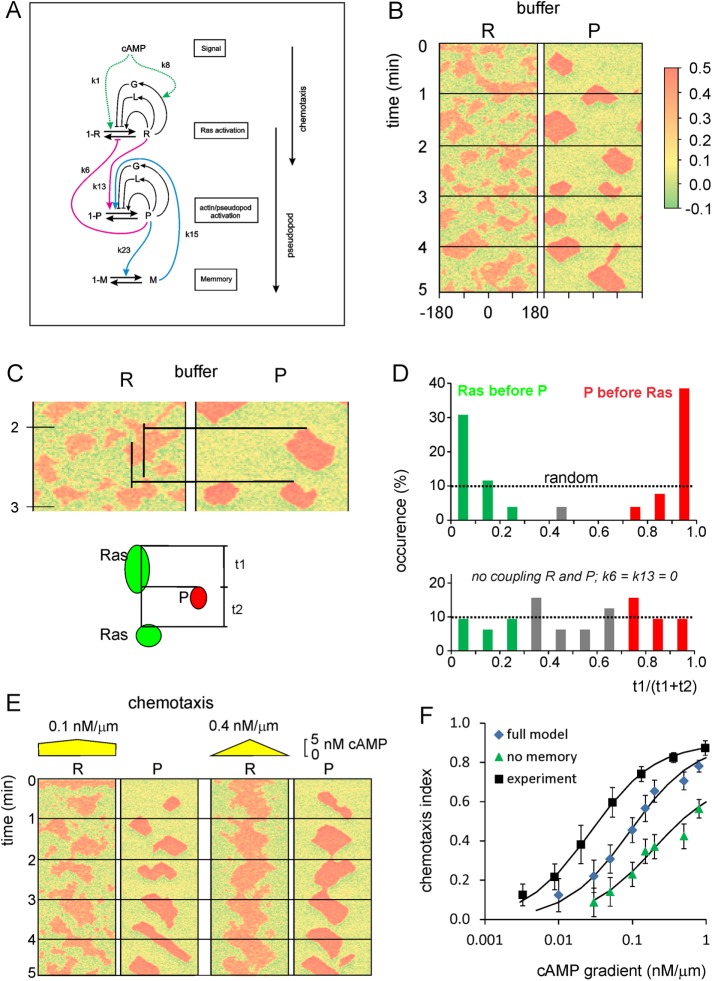
FIGURE 7:
Computational model for the coupled excitable activation of Ras and inducer of protrusions. (A) Scheme of the model. Ras-GTP is represented by R, which is formed by GEFs that are autocatalytically activated by R or by cAMP and are inhibited by a global inhibitor and a local inhibitor; R is degraded by GAPs. The inducer of protrusions, which could be Rac-GTP, Scar, or F-actin, is represented by P and is regulated in a similar way as R. The excitable R and P are coupled (red lines). Finally, experiments reveal that the system has memory, which resides in protrusions but not in Ras-GTP; it is modeled as a slowly degrading M that is formed in response to P and stimulates the formation of P. The model contains Gaussian white noise, which is slightly larger for R than for P, and by which patches of R are formed more frequently than patches of P. Simulations are performed on a circle with 120 grid points. (B) Kymograph of R and P for a typical simulation in buffer. (C, D) Coupling of R and P. The schematic shows a red patch of P. At the grid point of the start of P, the time intervals t1 and t2 were determined at which in that grid point the previous and the next patch of R started. The kymograph in C shows two cases; the upper P patch is closely preceded by an R patch, and the next R patch follows much later; the lower P patch shows the opposite. The data from 58 P patches are summarized in D; bottom, coupling constants k6 and k13 are set to zero. (E) Kymograph of R and P for typical simulations in a shallow (left) and steep (right) gradient of cAMP. (F) The chemotactic index was calculated using the position where each P patch started relative to the highest cAMP concentration (Supplemental Figure S5). Data are means and SD of 100 simulations for each cAMP gradient for the full model and the model lacking the memory (k15 = 0). The experimental data were collected before using micropipettes (Kortholt et al., 2013).

