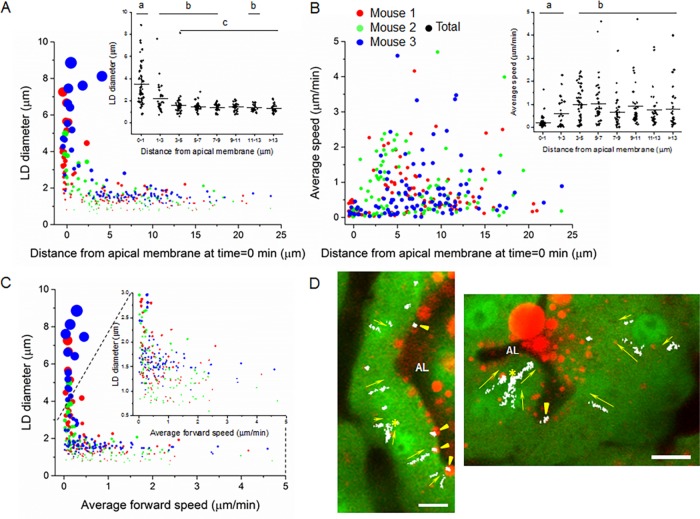
FIGURE 2:
Kinetic analysis of LD movement in GFPcyto mouse mammary cells. Manually tracked data points from three mice are color coded and proportionally adjusted to indicate relative LD volumes (A, C). (A) Relationship between LD diameter and distance from the apical surface at the beginning of each track. Inset, binned data for all three mice. Mean values labeled with different letters are significantly different from each other, p ≤ 0.05 (pairwise comparison using Tukey and Kramer test). (B) Relationship between average LD speed and distance from the apical surface at the beginning of each track. Inset, binned data for all three mice. Mean values labeled with different letters are significantly different from each other (pairwise comparison using Tukey and Kramer test), p < 0.05. (C) Relationship between LD diameter and average forward speed. Inset, enlarged area encompassing LDs ≤3 μm in diameter. (D) Vector map showing the direction (yellow arrows) of LD movement in representative movies. Examples of mobile and stationary LDs are indicated by yellow arrows and arrowheads, respectively, and points of LD fusion by yellow asterisks. AL, alveolar lumen. Bars, 10 μm (D).

