Figure 1.
Transcriptome-Wide Mapping of m5C Using bsRNA-Seq in Arabidopsis.
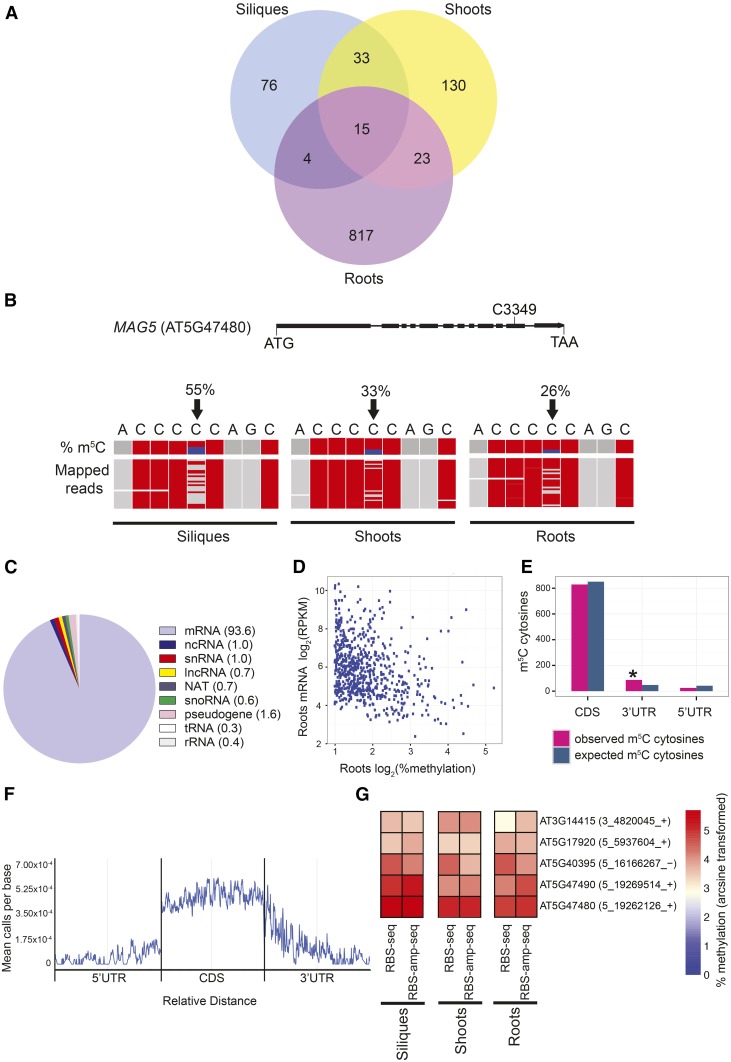
(A) Venn diagram showing the number of m5C sites in Arabidopsis wild-type (Col-0) siliques at 1 d after pollination, seedling shoots at 10 d after germination (DAG), and seedling roots at 6 DAG using bsRNA-seq/RBS-seq (n = 2–3). Methylated sites are called as significant at FDR ≤ 0.3 and ≥1% methylation.
(B) Gene schematic and genome browser view of a differentially methylated gene, MAG5, in three different tissue types. In the MAG5 gene schematic, the methylated cytosine C3349 is indicated. Boxes represent exons; lines represent introns. In the genome browser view, black arrows indicate m5C position C3349 (chr5: 19, 262, 126). Top: m5C methylation percentage (proportion of blue in column represents methylation percentage or numbers of nonconverted cytosines). Bottom: a subset of bsRNA-seq reads mapped to the MAG5 locus (chr5: 19, 262, 122-19, 262, 130) from the separate tissue data sets: siliques, shoots, and roots. Each row represents one sequence read and each column a nucleotide. Gray boxes represent nucleotides matching with the MAG5 reference sequence, and red boxes indicate mismatching nucleotides and/or nonmethylated, bisulfite converted cytosines. Sequencing gaps are shown in white.
(C) Distribution of m5C sites within different RNA types from siliques, shoots, and roots. The numbers in parentheses are percentage of total.
(D) Scatterplot showing that increased methylation correlates with lower mRNA abundance in Arabidopsis roots (rs = −0.32, *P value ≤ 0.0001, Spearman’s correlation).
(E) Histogram showing relative enrichment of observed m5C sites versus expected number of m5C sites in the 3′UTR compared with the CDS and 5′UTR across all three tissue types (*P value ≤ 0.0001, binomial test).
(F) Metagene profile of m5C site abundance along 5′UTR, CDS, and 3′UTRs, normalized for transcript length (relative distance) across all three tissue types (FDR ≤ 0.3 and ≥2% methylation).
(G) Methylation of candidate m5C sites using bsRNA-amp-seq/RBS-amp-seq was analyzed to independently confirm bsRNA-seq results. Heat map depicts log arcsine transformed methylation percentages of five m5C sites in Arabidopsis wild-type siliques, shoots, and roots using bsRNA-seq and bsRNA-amp-seq. The numbers in parentheses are genome coordinates, and + or – indicates the strand.

