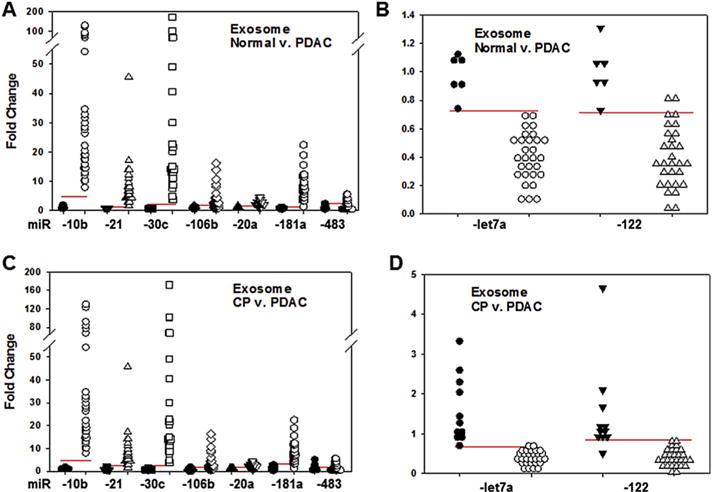
Fig. 3.

Dot plots of exosomal miR levels. The levels of exosomal miRs were assayed in normal controls, pancreatic cancer (PDAC), and chronic pancreatitis (CP) samples. Using RT-qPCR, miR-10b, -21, -30c, -106b, -20a, -181a, -483, -let7a, and -122 were assessed. (A and B) Individual normal control values were expressed as fold change from the mean value for controls (closed symbols). These values clustered separately from PDAC values (open symbols) for miRs which were overexpressed (A) or underexpressed (B) compared to respective mean normal values. (C and D) Similarly, CP values (closed symbols) clustered separately from PDAC values (open symbols). Horizontal lines represent cutoff values generated by ROC statistics.
