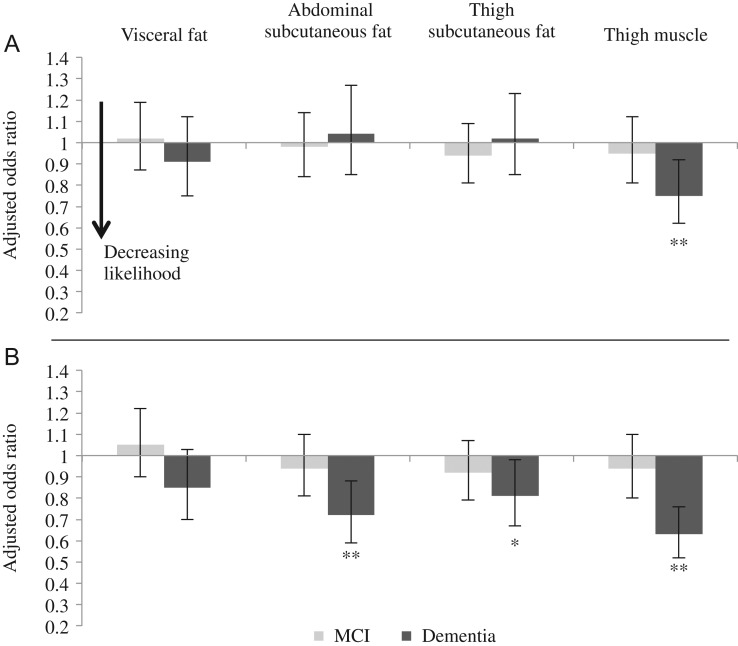
Figure 1.
Associations between BC and cognitive status in men (Panel A) and women (Panel B) adjusted for potential confounders or mediators (Model 2). Model 2: Adjustment for age, educational level, smoking status, depressive symptoms, type 2 diabetes, hypertension, stroke, triglyceride/HDL ratio and hs-CRP. Bars are odds ratios per SD increase in BC measures and error bars are 95% confidence intervals. Reference group is the normal cognitive status group. *P-value <0.05, **P-value <0.01.

