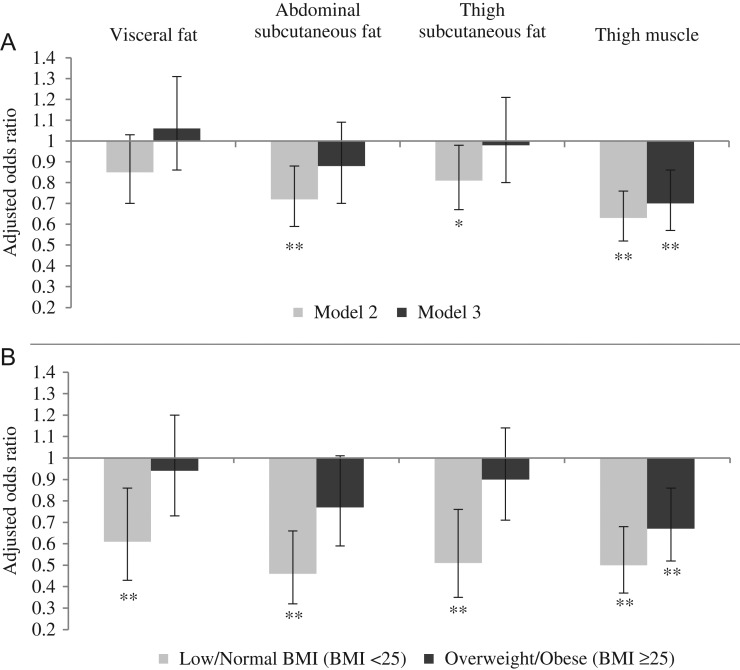
Figure 2.
Panel A shows associations between BC and cognitive status in women before (Model 2) and after (Model 3) additional adjustment for percentage change in weight from midlife and Panel B shows the associations of Model 2 stratified by midlife BMI category. Model 2: Adjustment for age, educational level, smoking status, depressive symptoms, type 2 diabetes, hypertension, stroke, triglyceride/HDL ratio and hs-CRP; Model 3: Model 2 + adjustment for % change in weight from midlife. Bars are odds ratios for dementia per SD increase in BC measures and error bars are 95% confidence intervals. Reference group is the normal cognitive status group and odds ratios for MCI are not shown. *P-value <0.05, **P-value <0.01.

